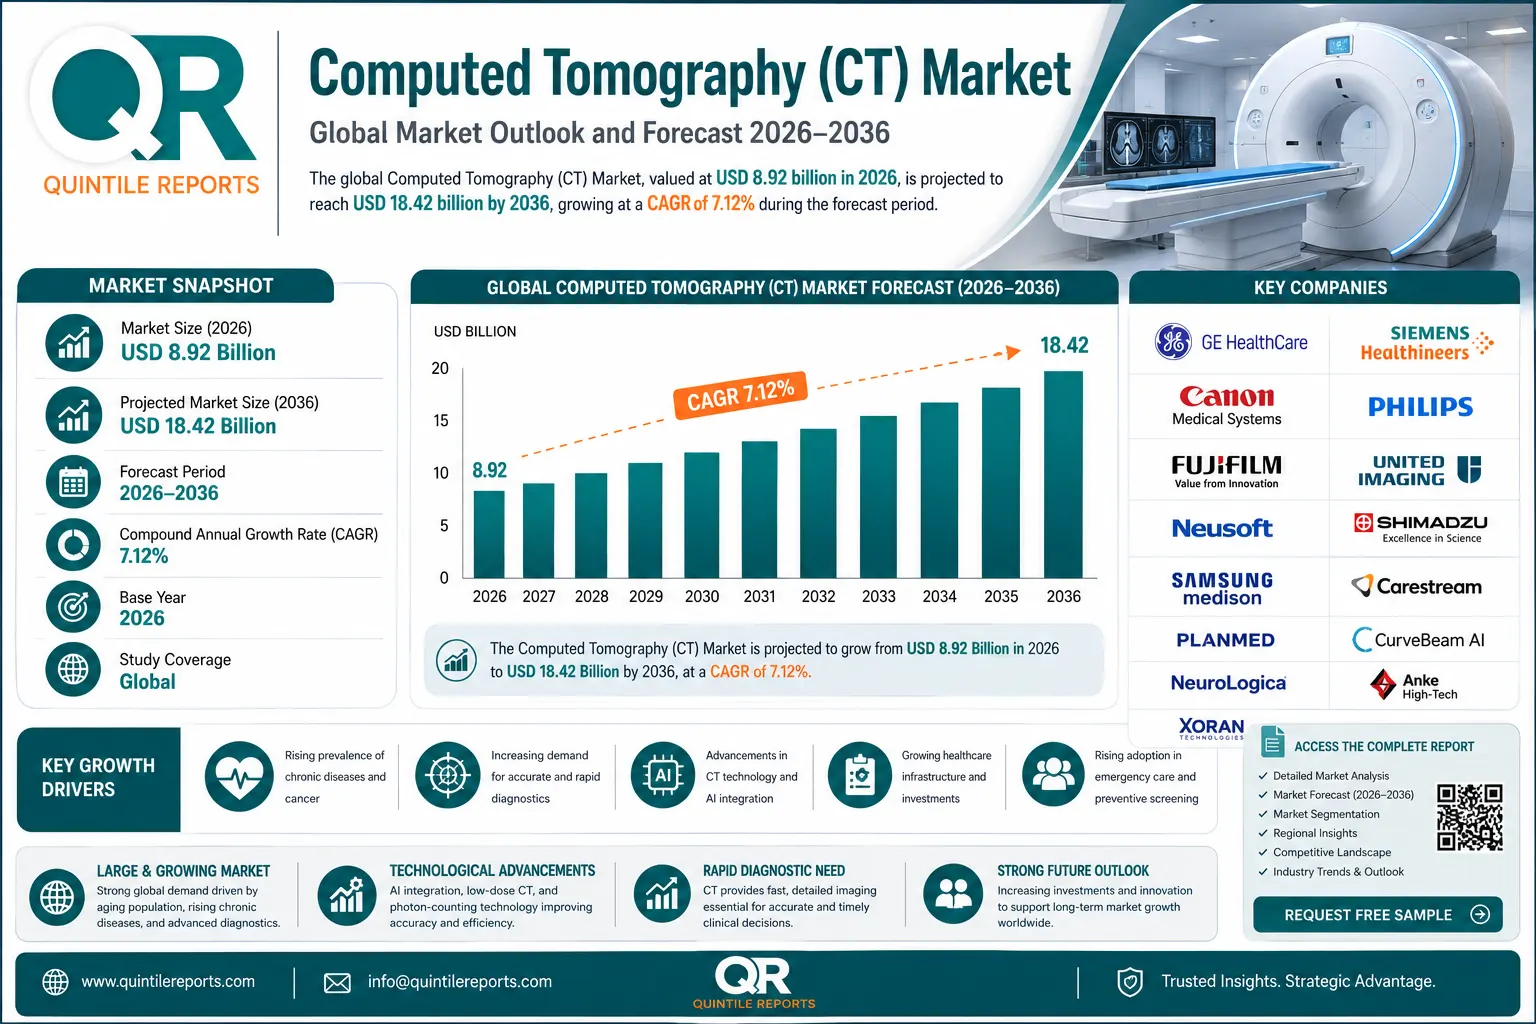
The global Computed Tomography (CT) Market, valued at USD 8.92 billion in 2026, is projected to reach USD 18.42 billion by 2036, registering a CAGR of 7.12% during the forecast period. The market is witnessing significant growth driven by the increasing prevalence of chronic diseases, rising demand for rapid and accurate diagnostic imaging, and continuous technological advancements in computed tomography systems. Growing adoption of artificial intelligence (AI)-enabled image reconstruction, photon-counting CT technology, low-dose imaging solutions, and advanced visualization software is transforming diagnostic workflows while improving clinical outcomes and patient safety. Furthermore, expanding healthcare infrastructure, increasing investments in precision medicine, and the growing need for early disease detection are expected to support sustained market expansion over the forecast period.
Computed Tomography (CT) is a highly advanced diagnostic imaging technology that combines X-ray imaging with sophisticated computer algorithms to produce detailed cross-sectional and three-dimensional images of internal organs, blood vessels, bones, and soft tissues. CT systems play a critical role in diagnosing and monitoring a broad range of medical conditions, including cancer, cardiovascular diseases, neurological disorders, trauma, pulmonary diseases, and musculoskeletal abnormalities. Modern CT scanners incorporate high-speed image acquisition, iterative reconstruction techniques, spectral imaging, AI-assisted diagnostics, automated workflow optimization, and cloud-based image management systems to improve diagnostic accuracy, reduce radiation exposure, and enhance operational efficiency. The growing integration of digital healthcare technologies and precision diagnostics continues to strengthen the clinical importance of CT imaging across hospitals, diagnostic imaging centers, emergency departments, and specialized healthcare facilities worldwide.
The growing burden of chronic diseases, coupled with the increasing need for rapid and accurate diagnosis, continues to drive global demand for computed tomography systems. CT imaging has become one of the most widely utilized diagnostic modalities owing to its ability to deliver high-resolution images within seconds, making it indispensable in emergency medicine, oncology, cardiology, neurology, and trauma care. Continuous technological advancements, including AI-powered image reconstruction, spectral CT, photon-counting detectors, and automated workflow solutions, are improving image quality while reducing radiation exposure and scan times. Furthermore, increasing healthcare investments, expanding hospital infrastructure, and rising awareness regarding preventive healthcare are accelerating CT adoption worldwide.
Despite continuous technological advancements, the high capital investment associated with purchasing, installing, and maintaining advanced CT systems remains a significant barrier, particularly for small hospitals and healthcare facilities in developing economies. Additionally, concerns regarding cumulative radiation exposure from repeated CT examinations continue to influence physician prescribing patterns and patient preference. Regulatory compliance, regular equipment upgrades, and the need for highly skilled radiology professionals further increase the total cost of ownership, limiting broader market penetration.
Rapid advancements in artificial intelligence, deep learning algorithms, and photon-counting detector technology are creating new opportunities for CT manufacturers to improve diagnostic accuracy, automate image interpretation, and enhance workflow efficiency. Growing investments in digital healthcare, cloud-based radiology platforms, and precision medicine are further supporting market expansion. Moreover, increasing healthcare infrastructure development across emerging economies, coupled with rising government investments in diagnostic imaging and preventive healthcare programs, presents substantial long-term growth opportunities for industry participants.
The global CT market is characterized by intense competition among established manufacturers, resulting in pricing pressure, rapid technological innovation, and shorter product replacement cycles. Healthcare providers increasingly demand cost-effective imaging solutions with advanced AI capabilities, forcing manufacturers to continuously invest in research and development while maintaining competitive pricing. Supply chain disruptions, evolving regulatory requirements, reimbursement uncertainties, and increasing cybersecurity risks associated with connected imaging systems may also affect future market growth and profitability.
| Factor | Impact on Computed Tomography (CT) Market |
| Political | Government investments in healthcare infrastructure, expansion of diagnostic imaging facilities, favorable reimbursement policies, and regulatory support for advanced medical imaging technologies continue to drive CT market growth. Public healthcare modernization initiatives across developed and emerging economies are increasing the adoption of advanced CT systems. |
| Economic | Increasing healthcare expenditure, rising investments in hospitals and diagnostic imaging centers, expanding private healthcare sectors, and growing demand for precision diagnostics are supporting market expansion. However, high acquisition, installation, and maintenance costs of advanced CT systems remain major challenges for budget-constrained healthcare providers. |
| Social | The growing prevalence of cancer, cardiovascular diseases, neurological disorders, pulmonary diseases, and trauma cases, along with an aging global population and increasing awareness of early disease diagnosis, continues to accelerate demand for CT imaging worldwide. |
| Technological | Continuous innovations including AI-assisted image reconstruction, photon-counting CT, spectral imaging, low-dose radiation technologies, cloud-based imaging platforms, automated workflow optimization, and advanced visualization software are significantly improving diagnostic accuracy and operational efficiency. |
| Legal | Strict regulatory approvals from agencies such as the FDA, CE, and other national regulatory authorities ensure product quality, patient safety, cybersecurity compliance, radiation safety standards, and clinical effectiveness before commercialization. |
| Environmental | Manufacturers are increasingly focusing on energy-efficient CT systems, environmentally sustainable manufacturing, reduced power consumption, recyclable components, and eco-friendly product lifecycle management to support global sustainability initiatives. |
| Porter's Five Forces | Analysis |
| Threat of New Entrants | Low – High capital investment, extensive research & development requirements, stringent regulatory approvals, advanced manufacturing capabilities, and strong brand recognition create substantial entry barriers for new market participants. |
| Bargaining Power of Suppliers | Moderate – Suppliers of X-ray tubes, detectors, semiconductors, AI software, and advanced imaging components possess moderate bargaining power due to technological specialization. However, major CT manufacturers maintain diversified global supply chains to reduce procurement risks. |
| Bargaining Power of Buyers | Moderate to High – Large hospital networks, diagnostic imaging chains, and healthcare systems possess significant negotiating power because of bulk purchasing, competitive bidding, and availability of multiple established CT equipment manufacturers. |
| Threat of Substitutes | Moderate – MRI, ultrasound, PET, X-ray, and nuclear imaging serve as alternative diagnostic modalities for selected clinical applications. However, CT remains the preferred imaging technology for emergency medicine, trauma imaging, lung assessment, vascular imaging, and rapid whole-body diagnosis. |
| Competitive Rivalry | High – The global CT market is highly competitive, with leading manufacturers focusing on AI-powered imaging, photon-counting CT, low-dose imaging technologies, workflow automation, strategic partnerships, product innovation, mergers & acquisitions, and global expansion to strengthen their competitive position. |
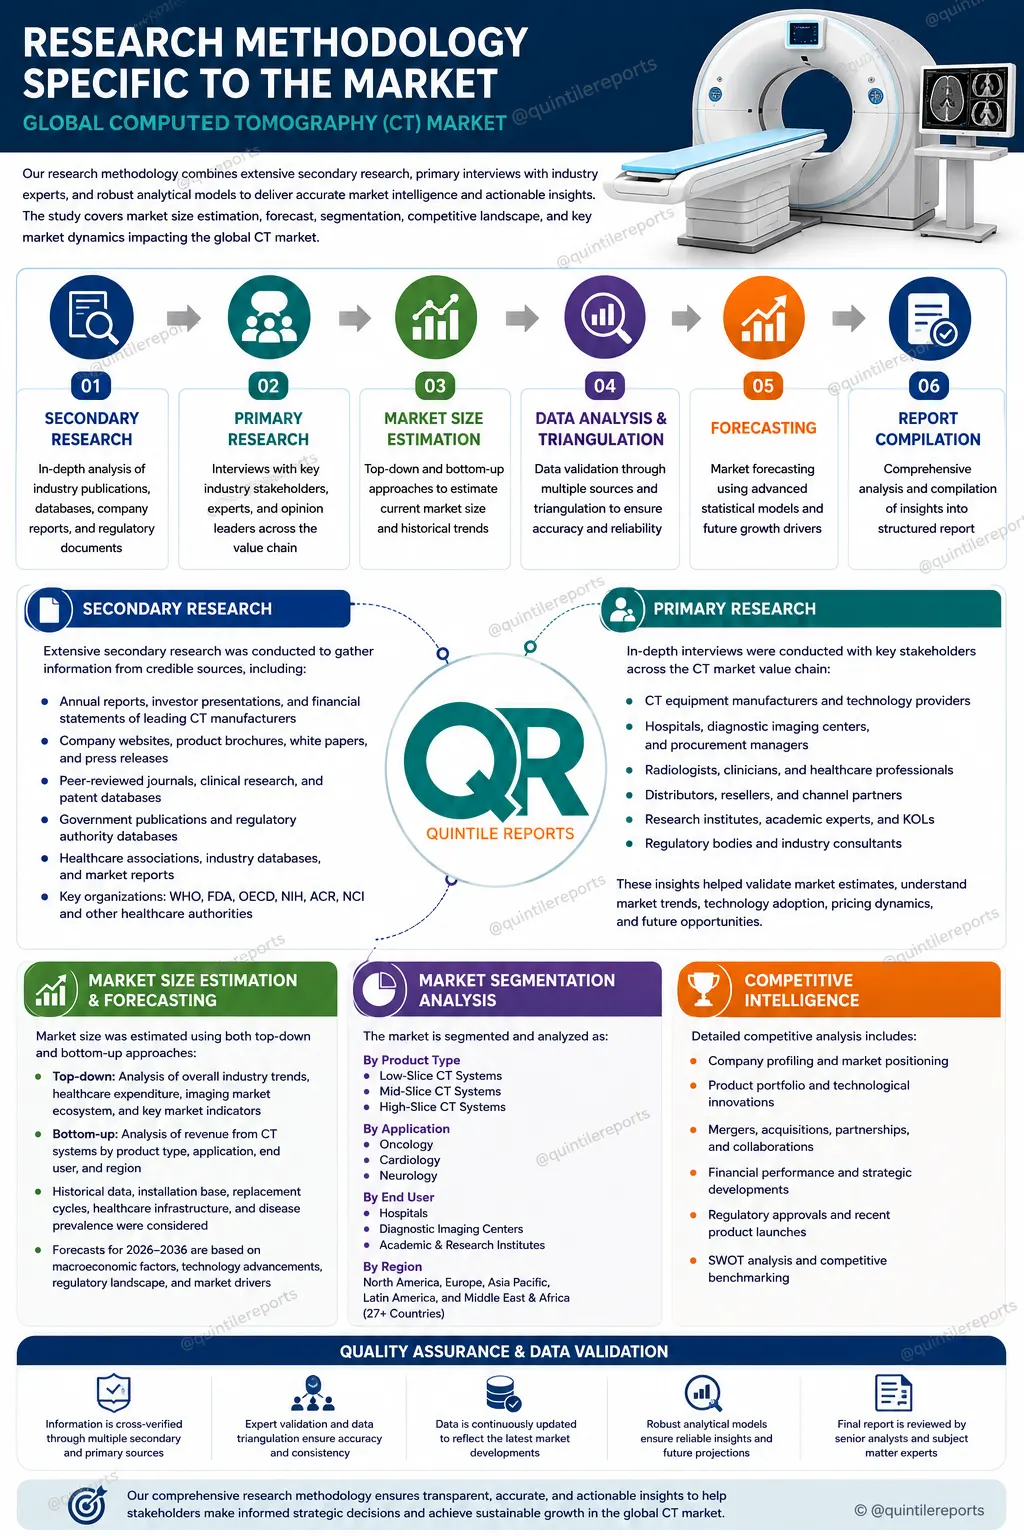
The global Computed Tomography (CT) Market is segmented based on Product Type, Application, and End User.
Based on product type, the Computed Tomography (CT) market is segmented into Low-Slice CT Systems, Mid-Slice CT Systems, and High-Slice CT Systems.
High-Slice CT Systems represent the largest revenue-generating segment of the global Computed Tomography market due to their superior imaging capabilities, rapid scan speeds, and exceptional diagnostic accuracy. These systems, including 128-slice, 256-slice, and 320-slice CT scanners, are extensively utilized for complex clinical applications such as cardiovascular imaging, oncology, neurology, trauma diagnosis, and emergency medicine. Their ability to produce high-resolution three-dimensional images while significantly reducing motion artifacts makes them indispensable for modern healthcare facilities.
Continuous technological innovations including artificial intelligence-assisted image reconstruction, spectral CT imaging, photon-counting detectors, iterative reconstruction algorithms, and ultra-low-dose imaging have further enhanced clinical performance while improving patient safety and operational efficiency. Large tertiary hospitals and advanced diagnostic imaging centers continue investing in high-slice CT systems to support precision diagnostics, image-guided interventions, and comprehensive disease management.
Mid-Slice CT Systems continue to experience strong market growth owing to their optimal balance between diagnostic performance and cost-effectiveness. These systems are widely adopted by multispecialty hospitals, regional healthcare facilities, and independent diagnostic imaging centers for routine neurological, thoracic, abdominal, orthopedic, and vascular examinations.
Growing healthcare investments across emerging economies, expanding diagnostic imaging infrastructure, and increasing demand for affordable advanced imaging technologies are driving adoption. Furthermore, improvements in detector efficiency, AI-powered workflow optimization, and dose reduction technologies continue to improve diagnostic accuracy while maintaining competitive operating costs.
Low-Slice CT Systems remain important for routine diagnostic imaging, particularly in community hospitals, rural healthcare facilities, and resource-constrained healthcare settings. These systems provide reliable imaging for trauma assessment, pulmonary examinations, orthopedic imaging, and general diagnostic applications while requiring lower capital investment and maintenance costs.
Although technological limitations compared to high-slice systems restrict their use in advanced cardiac and neurological imaging, continued modernization programs and healthcare expansion initiatives in developing countries continue supporting demand for low-slice CT systems.
Based on application, the Computed Tomography (CT) market is segmented into Oncology, Cardiology, and Neurology.
Oncology represents the largest application segment within the global CT market due to the increasing global incidence of cancer and growing demand for early disease diagnosis. CT imaging plays a critical role throughout the oncology care pathway, including tumor detection, disease staging, treatment planning, radiation therapy guidance, biopsy planning, therapeutic response assessment, and recurrence monitoring.
Advanced technologies including spectral CT, AI-assisted lesion detection, automated tumor segmentation, and three-dimensional visualization continue improving diagnostic confidence and clinical decision-making. The growing emphasis on precision oncology and personalized medicine is further increasing investments in next-generation CT imaging systems across cancer centers worldwide.
Cardiology is expected to witness the fastest growth during the forecast period owing to the increasing prevalence of cardiovascular diseases and growing adoption of coronary CT angiography (CCTA). Modern CT scanners enable rapid non-invasive visualization of coronary arteries, cardiac anatomy, myocardial perfusion, structural heart disease, and vascular abnormalities with excellent spatial resolution.
Continuous innovations in high-speed detectors, dual-source CT, AI-assisted cardiac analysis, and ultra-low radiation imaging are significantly improving diagnostic performance while expanding clinical applications across preventive cardiology and cardiovascular risk assessment.
Neurology remains one of the most important applications for CT imaging, particularly in emergency medicine where rapid diagnosis is essential. CT scanners are routinely utilized for stroke diagnosis, traumatic brain injuries, intracranial hemorrhage, brain tumors, hydrocephalus, and neurovascular disorders.
The increasing incidence of stroke worldwide, combined with expanding emergency healthcare infrastructure and faster imaging technologies, continues driving CT utilization in neurological care. AI-powered stroke detection and automated hemorrhage identification software are further enhancing diagnostic speed and treatment outcomes.
Based on End User, the Computed Tomography (CT) market is segmented into Hospitals, Diagnostic Imaging Centers, and Academic & Research Institutes.
Hospitals account for the largest share of the global CT market owing to their high patient volumes, advanced diagnostic capabilities, and comprehensive healthcare services. CT systems are extensively utilized across emergency departments, trauma centers, oncology units, cardiovascular departments, neurological centers, and intensive care units.
Growing investments in hospital modernization, digital radiology, AI-enabled diagnostic platforms, and precision medicine continue driving procurement of next-generation CT scanners. Large healthcare organizations increasingly invest in high-performance CT systems capable of supporting multiple specialties while improving workflow efficiency and patient throughput.
Diagnostic Imaging Centers are expected to register the fastest growth throughout the forecast period due to increasing demand for outpatient diagnostic services, shorter waiting times, and cost-effective imaging solutions. These facilities perform large volumes of routine CT examinations for oncology, cardiology, orthopedics, pulmonary diseases, and preventive health screening.
The continued shift toward outpatient healthcare delivery, increasing healthcare accessibility, and expansion of independent imaging facilities are expected to support long-term market growth.
Academic and Research Institutes play an essential role in advancing CT imaging technologies through clinical research, product development, medical education, and innovation. These organizations actively evaluate emerging technologies including photon-counting CT, AI-assisted diagnostics, low-dose imaging protocols, spectral CT, and advanced image reconstruction algorithms.
Collaborative research between universities, hospitals, medical device manufacturers, and government institutions continues accelerating technological innovation while supporting future commercialization of next-generation CT imaging systems.
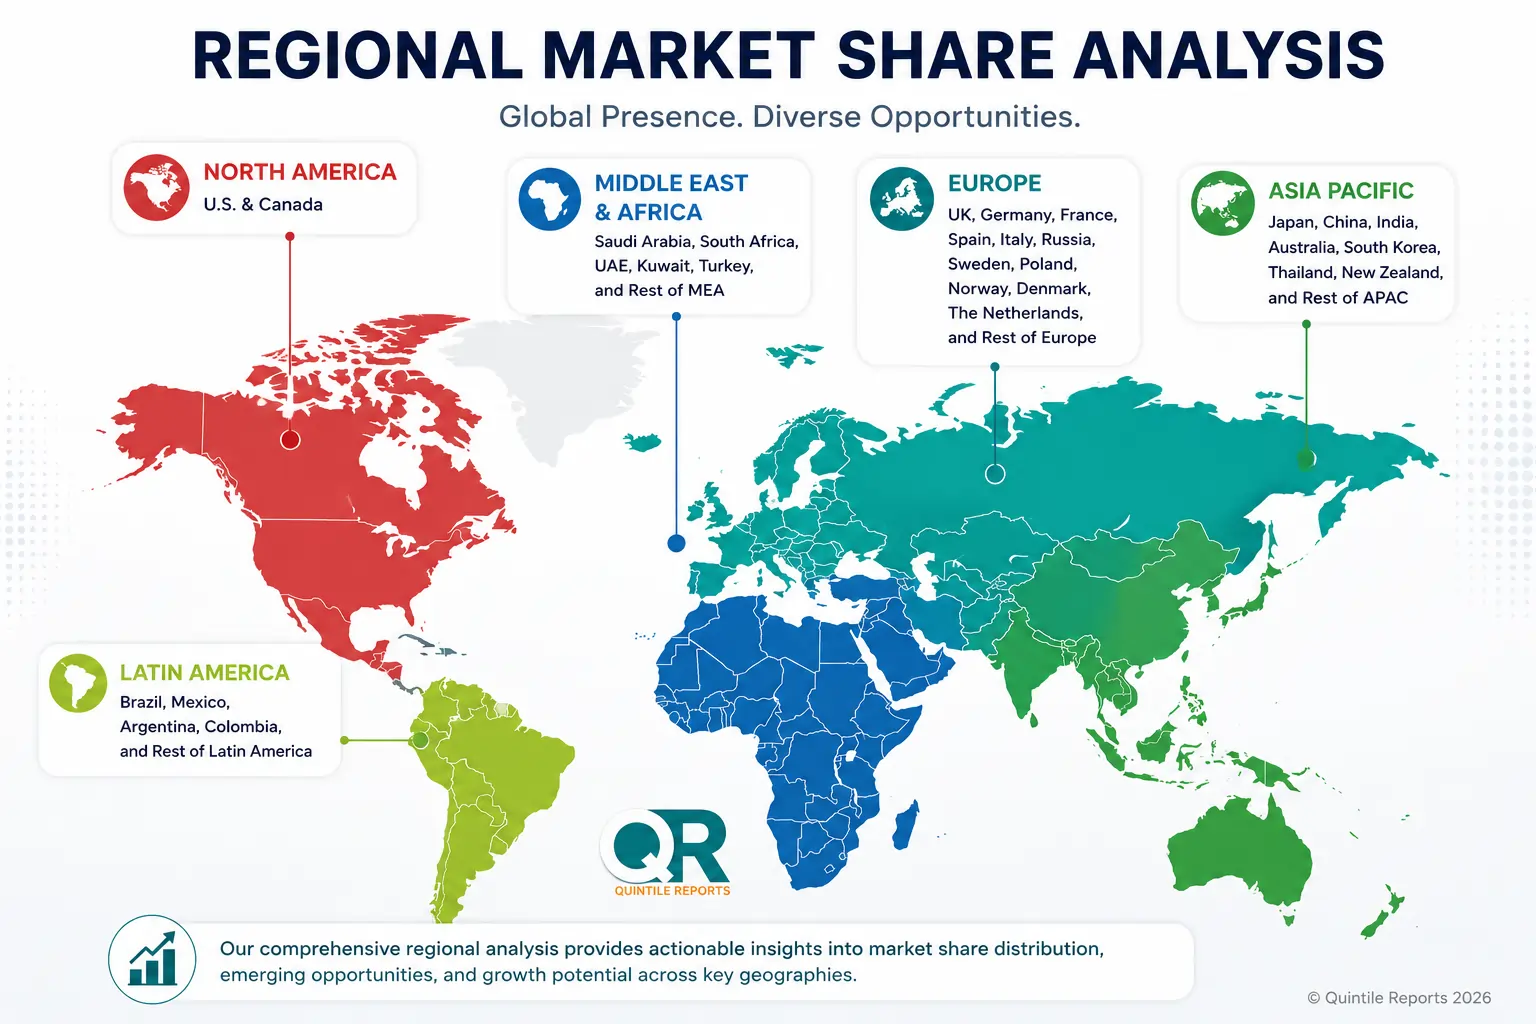
Based on geography, the Computed Tomography (CT) Market is segmented into North America, Europe, Asia Pacific, Latin America, and the Middle East & Africa.
Our updated report version includes a comprehensive regional scope chapter covering 5 major regions and 27+ countries, providing in-depth analysis of market size, growth forecasts, competitive landscape, healthcare infrastructure, regulatory environment, technological advancements, and country-level growth opportunities.
The report provides detailed coverage of:
This extensive regional coverage enables stakeholders to evaluate country-level demand, healthcare investments, reimbursement landscape, competitive positioning, technological adoption, regulatory developments, and future growth opportunities, supporting informed strategic planning and business expansion decisions.
North America accounts for the largest share of the global Computed Tomography (CT) market, supported by its highly developed healthcare infrastructure, widespread adoption of advanced diagnostic imaging technologies, and substantial healthcare expenditure. The United States remains the dominant contributor owing to the presence of leading medical imaging manufacturers, favorable reimbursement frameworks, and continuous investments in precision diagnostics and digital healthcare transformation. Hospitals and diagnostic imaging centers across the region are rapidly adopting next-generation CT systems incorporating artificial intelligence (AI), photon-counting detector technology, low-dose imaging protocols, and advanced visualization software to improve diagnostic accuracy and operational efficiency.
The increasing prevalence of cancer, cardiovascular diseases, neurological disorders, pulmonary diseases, and traumatic injuries continues to drive demand for CT imaging across emergency departments, oncology centers, and specialty hospitals. Furthermore, ongoing replacement of conventional CT systems with high-performance scanners, increasing investments in cloud-based imaging platforms, and expanding research collaborations between healthcare institutions and technology providers are expected to sustain North America's leadership throughout the forecast period.
Europe represents a mature and technologically advanced Computed Tomography market, driven by well-established healthcare systems, favorable government healthcare spending, and continuous modernization of diagnostic imaging infrastructure. Countries including Germany, the United Kingdom, France, Italy, Spain, and the Nordic nations continue investing in advanced CT scanners featuring AI-assisted image reconstruction, spectral imaging, and low-dose radiation technologies to improve diagnostic quality while enhancing patient safety.
The growing aging population, increasing burden of chronic diseases, and expanding demand for preventive healthcare are supporting the widespread utilization of CT imaging across hospitals and outpatient diagnostic facilities. In addition, strong regulatory standards, increasing adoption of precision medicine, expanding clinical research activities, and ongoing technological innovation by leading manufacturers continue to strengthen Europe's position as one of the world's largest CT imaging markets.
Asia Pacific is projected to register the fastest growth during the forecast period owing to rapid healthcare infrastructure development, increasing healthcare expenditure, expanding hospital networks, and rising awareness regarding early disease diagnosis. Major economies including China, India, Japan, South Korea, Australia, and Southeast Asian countries continue investing heavily in advanced diagnostic imaging technologies to address the increasing burden of chronic diseases and improve healthcare accessibility.
Government initiatives supporting healthcare modernization, increasing medical insurance coverage, growing medical tourism, and rising disposable incomes are accelerating the installation of advanced CT systems across hospitals and diagnostic imaging centers. Furthermore, the growing adoption of AI-enabled imaging solutions, digital radiology platforms, and cost-effective multi-slice CT scanners presents significant opportunities for both global and regional manufacturers. Expanding manufacturing capabilities and strategic investments by leading imaging companies are expected to further support long-term regional market growth.
The Latin American Computed Tomography market is experiencing steady growth, supported by improving healthcare infrastructure, increasing government healthcare investments, and expanding access to advanced diagnostic imaging services. Countries including Brazil, Mexico, Argentina, Chile, and Colombia continue modernizing hospital infrastructure while increasing procurement of advanced CT imaging systems to improve disease diagnosis and emergency healthcare services.
The increasing prevalence of cardiovascular diseases, cancer, respiratory disorders, and trauma cases is driving greater utilization of CT imaging across public and private healthcare facilities. Growing private healthcare investments, expansion of independent diagnostic imaging centers, and increasing awareness regarding preventive health screening are expected to further strengthen market demand. Although high equipment costs and uneven healthcare accessibility remain challenges, ongoing healthcare reforms and improving reimbursement systems continue creating favorable growth opportunities.
The Middle East & Africa Computed Tomography market is gradually expanding due to increasing investments in healthcare infrastructure, modernization of public hospitals, and growing adoption of advanced diagnostic imaging technologies. Countries including Saudi Arabia, the United Arab Emirates, Qatar, Kuwait, South Africa, and Egypt are investing significantly in healthcare digitalization, specialty hospitals, and advanced medical imaging equipment to improve diagnostic capabilities.
The rising burden of chronic diseases, expanding private healthcare sector, growing medical tourism, and increasing government initiatives aimed at strengthening healthcare delivery continue to support CT market growth across the region. Additionally, ongoing investments in artificial intelligence-enabled imaging, emergency healthcare services, and diagnostic center expansion are creating new opportunities for market participants. Although disparities in healthcare accessibility and limited availability of advanced imaging infrastructure persist in several developing countries, increasing public-private partnerships and foreign investments are expected to drive long-term market expansion throughout the forecast period.
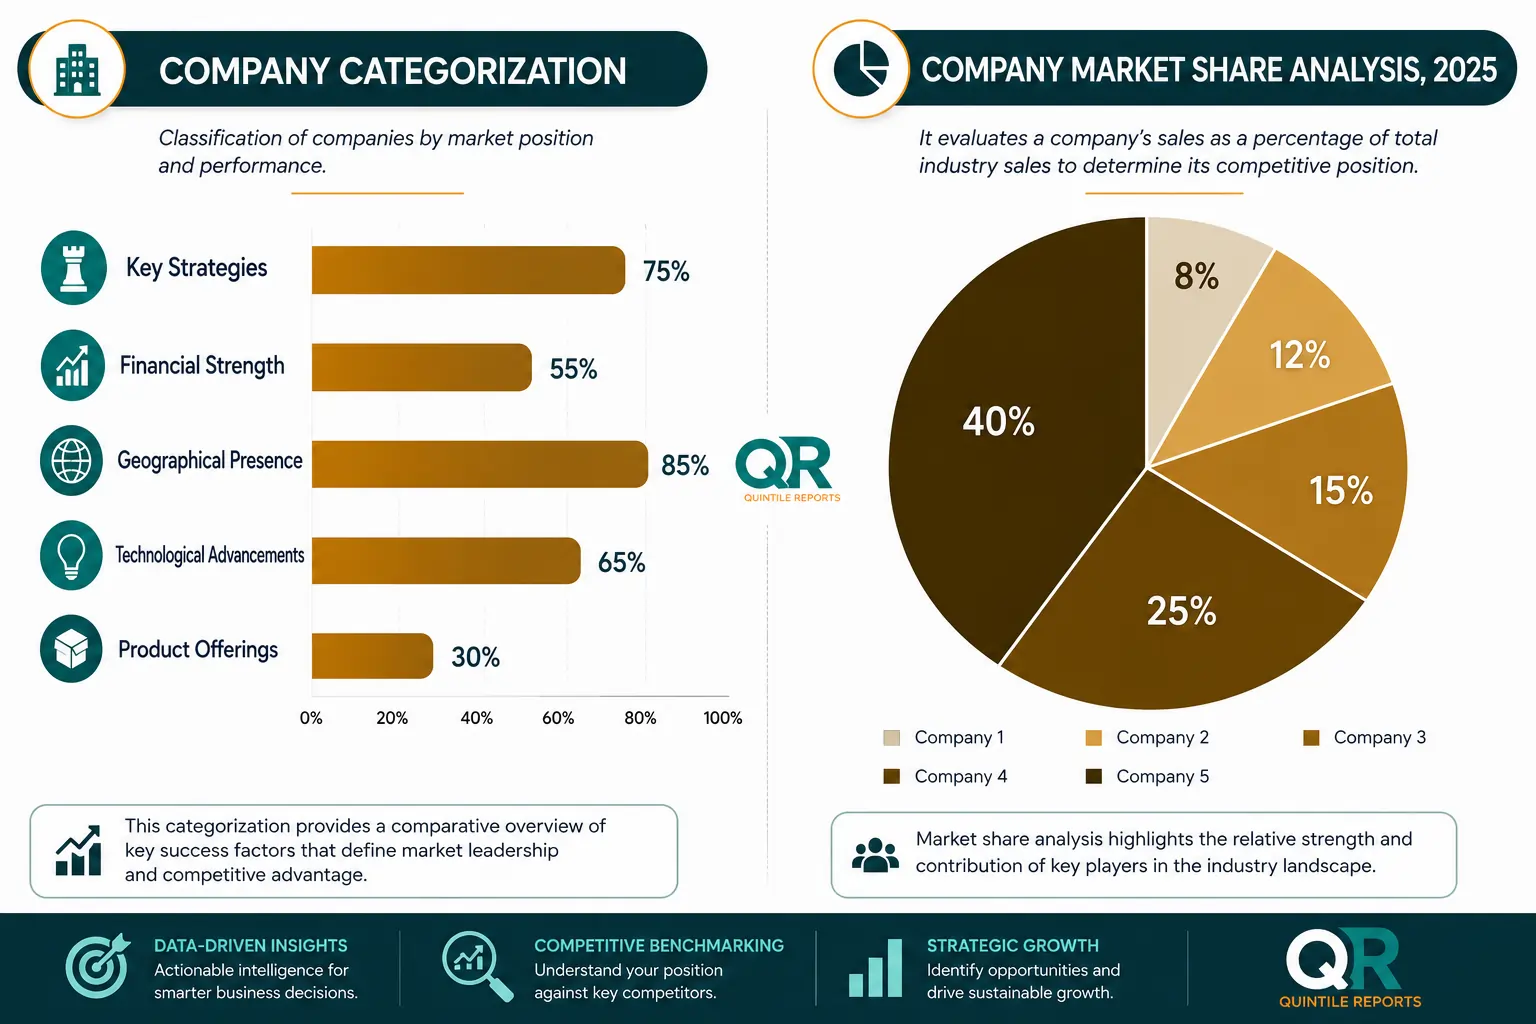
The global Computed Tomography (CT) Market is highly competitive and moderately consolidated, with leading multinational companies competing through continuous technological innovation, product portfolio expansion, artificial intelligence (AI)-enabled imaging solutions, and strategic partnerships. Market participants are focused on developing next-generation CT systems that deliver superior image quality, faster scan times, reduced radiation exposure, and improved workflow efficiency to meet the growing demand for precision diagnostics and value-based healthcare.
Competition is primarily based on technological capabilities, detector performance, image reconstruction software, AI integration, product reliability, pricing strategies, regulatory approvals, service support, and global distribution networks. Manufacturers are also investing significantly in research & development (R&D), cloud-based imaging platforms, photon-counting CT technology, spectral imaging, and digital healthcare solutions to strengthen their competitive positioning. Furthermore, companies continue expanding their manufacturing capabilities and regional presence through mergers & acquisitions, strategic collaborations, and healthcare partnerships to capture emerging market opportunities.
Leading companies operating in the Computed Tomography (CT) market are actively pursuing several strategic initiatives to strengthen their market position and accelerate long-term growth. Key strategies include:
The competitive landscape is expected to remain dynamic throughout the forecast period as companies continue to invest in advanced imaging technologies, digital transformation, strategic collaborations, and geographic expansion to capitalize on the growing global demand for high-performance computed tomography systems.
| Report Scope | Details |
| Report Version | 2026 |
| Growth Rate | CAGR of 7.12 % from 2026 to 2036 |
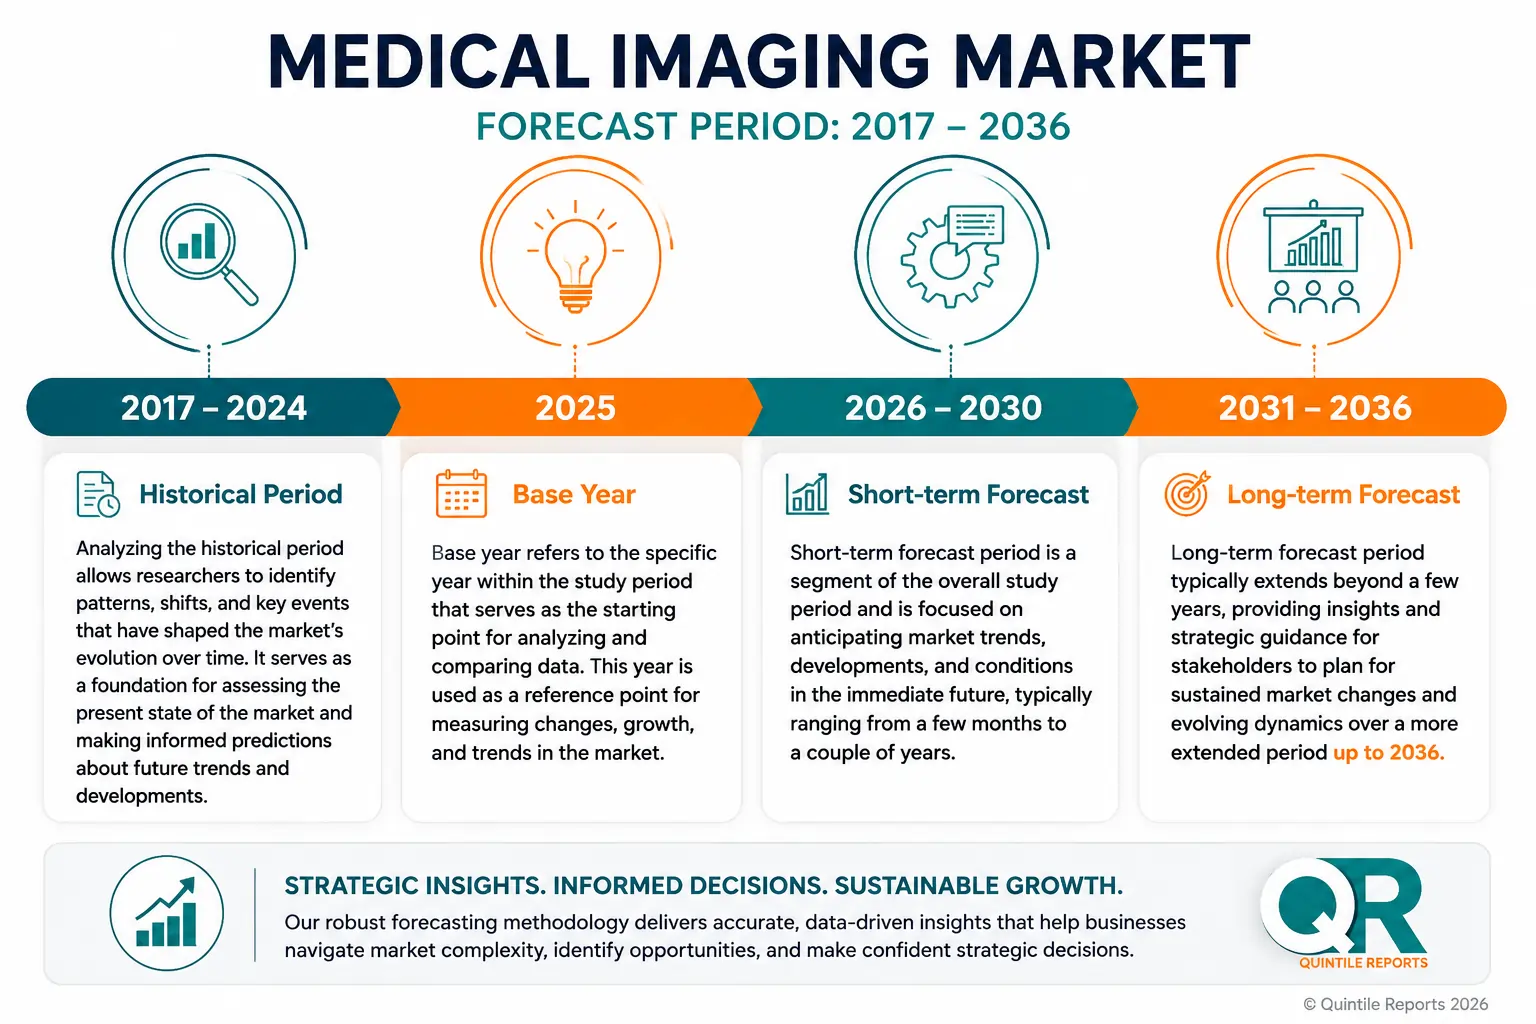
| Base Year | 2025 |
| Actual Estimates / Historical Data | 2017 - 2024 |
| Forecast Period | 2026 - 2036 |
| Quantitative Units | Revenue in USD million/billion & CAGR from 2026 to 2036 |
| Country Scope | North America (U.S., Canada), Europe (UK, Germany, France, Italy, Spain, Russia, Sweden, Denmark, Norway, Rest of Europe), Asia Pacific (Japan, China, India, Australia, South Korea, Thailand, Rest of Asia Pacific), Latin America (Brazil, Mexico, Argentina, Colombia, Rest of Latin America), Middle East & Africa (South Africa, Saudi Arabia, UAE, Kuwait, Rest of Middle East & Africa). |
| The Segment Covered by Product Type |
|
| The Segment Covered by Technology |
|
| Companies Covered |
|
| Report Coverage | Revenue forecast, company share, competitive landscape, growth factors, technology trends, and regional analysis |
| Free Customization Scope (Equivalent to 5 Analyst Working Days) | If you require additional insights beyond the current scope, our analysts can customize the report to meet your specific business needs. |

Prepared by: Shivani Patil
Designation: Senior Healthcare & Medical Devices Research Analyst
Organization: Quintile Reports
Shivani Patil is a Senior Healthcare & Medical Devices Research Analyst at Quintile Reports, with extensive expertise in diagnostic imaging, medical devices, life sciences, digital health, and healthcare technologies. She specializes in analyzing emerging market trends, technological innovations, competitive landscapes, regulatory developments, and investment opportunities across the global healthcare industry.
With significant experience in syndicated and custom market research, Shivani has authored numerous studies covering diagnostic imaging modalities, including Computed Tomography (CT), Magnetic Resonance Imaging (MRI), Ultrasound, X-ray Imaging, Nuclear Imaging, and Artificial Intelligence in Medical Imaging. Her expertise encompasses market sizing, forecasting, competitive intelligence, value chain analysis, market dynamics, and strategic business insights, enabling organizations to make informed investment and expansion decisions.
At Quintile Reports, Shivani leverages comprehensive primary research, extensive secondary research, and advanced analytical methodologies to deliver accurate, reliable, and actionable market intelligence. Her research supports medical device manufacturers, healthcare providers, investors, distributors, policymakers, and technology companies in identifying growth opportunities, evaluating competitive strategies, and navigating the evolving global diagnostic imaging market.
Table 1 List of Abbreviation and Acronyms
Table 2 List of Sources
Table 3 North America Computed Tomography (CT) Market, by Segment Analysis, (USD Million) 2017-2036
Table 4 North America Computed Tomography (CT) Market, by Region, (USD Million) 2017-2036
Table 5 U.S. Computed Tomography (CT) Market, by Segment Analysis, (USD Million) 2017-2036
Table 6 Canada Computed Tomography (CT) Market, by Segment Analysis, (USD Million) 2017-2036
Table 7 Europe Computed Tomography (CT) Market, by Segment Analysis, (USD Million) 2017-2036
Table 8 Europe Computed Tomography (CT) Market, by Region, (USD Million) 2017-2036
Table 9 Germany Computed Tomography (CT) Market, by Segment Analysis, (USD Million) 2017-2036
Table 10 U.K. Computed Tomography (CT) Market, by Segment Analysis, (USD Million) 2017-2036
Table 11 France Computed Tomography (CT) Market, by Segment Analysis, (USD Million) 2017-2036
Table 12 Italy Computed Tomography (CT) Market, by Segment Analysis, (USD Million) 2017-2036
Table 13 Spain Computed Tomography (CT) Market, by Segment Analysis, (USD Million) 2017-2036
Table 14 Sweden Computed Tomography (CT) Market, by Segment Analysis, (USD Million) 2017-2036
Table 15 Denmark Computed Tomography (CT) Market, by Segment Analysis, (USD Million) 2017-2036
Table 16 Norway Computed Tomography (CT) Market, by Segment Analysis, (USD Million) 2017-2036
Table 17 The Netherlands Computed Tomography (CT) Market, by Segment Analysis, (USD Million) 2017-2036
Table 18 Russia Computed Tomography (CT) Market, by Segment Analysis, (USD Million) 2017-2036
Table 19 Asia Pacific Global Market, by Segment Analysis, (USD Million) 2017-2036
Table 20 Asia Pacific Computed Tomography (CT) Market, by Region, (USD Million) 2017-2036
Table 21 China Computed Tomography (CT) Market, by Segment Analysis, (USD Million) 2017-2036
Table 22 Japan Computed Tomography (CT) Market, by Segment Analysis, (USD Million) 2017-2036
Table 23 India Computed Tomography (CT) Market, by Segment Analysis, (USD Million) 2017-2036
Table 24 Australia Computed Tomography (CT) Market, by Segment Analysis, (USD Million) 2017-2036
Table 25 South Korea Computed Tomography (CT) Market, by Segment Analysis, (USD Million) 2017-2036
Table 26 Thailand Computed Tomography (CT) Market, by Segment Analysis, (USD Million) 2017-2036
Table 27 Latin America Computed Tomography (CT) Market, by Segment Analysis, (USD Million) 2017-2036
Table 28 Latin America Computed Tomography (CT) Market, by Region, (USD Million) 2017-2036
Table 29 Brazil Computed Tomography (CT) Market, by Segment Analysis, (USD Million) 2017-2036
Table 30 Mexico Computed Tomography (CT) Market, by Segment Analysis, (USD Million) 2017-2036
Table 31 Argentina Computed Tomography (CT) Market, by Segment Analysis, (USD Million) 2017-2036
Table 32 Middle East and Africa Computed Tomography (CT) Market, by Segment Analysis, (USD Million) 2017-2036
Table 33 Middle East and Africa Computed Tomography (CT) Market, by Region, (USD Million) 2017-2036
Table 34 South Africa Computed Tomography (CT) Market, by Segment Analysis, (USD Million) 2017-2036
Table 35 Saudi Arabia Computed Tomography (CT) Market, by Segment Analysis, (USD Million) 2017-2036
Table 36 UAE Computed Tomography (CT) Market, by Segment Analysis, (USD Million) 2017-2036
Table 37 Kuwait Computed Tomography (CT) Market, by Segment Analysis, (USD Million) 2017-2036
Table 38 Turkey Computed Tomography (CT) Market, by Segment Analysis, (USD Million) 2017-2036
Fig.1 Market Research Process
Fig.2 Market Research Approaches
Fig.3 Global Computed Tomography (CT) Market: Market Scenario
Fig.4 Global Computed Tomography (CT) Market Competitive Outlook
Fig.5 Global Computed Tomography (CT) Market Driver Analysis
Fig.6 Global Computed Tomography (CT) Market Restraint Analysis
Fig.7 Global Computed Tomography (CT) Market Opportunity Analysis
Fig.8 Global Computed Tomography (CT) Market Trends Analysis
Fig.9 Global Computed Tomography (CT) Market: Segment Analysis (Based on the Scope)
Fig.10 Global Computed Tomography (CT) Market: Regional Analysis
Fig.11 Global Market Shares and Leading Market Players
Fig.12 North America Market Share and Leading Players
Fig.13 Europe Market Share and Leading Players
Fig.14 Asia Pacific Market Share and Leading Players
Fig.15 Latin America Market Share and Leading Players
Fig.16 Middle East & Africa Market Share and Leading Players
Fig.17 North America, by Country
Fig.18 North America
Fig.19 North America Market Estimates and Forecast, 2017-2036
Fig.20 U.S.
Fig.21 Canada
Fig.22 Europe
Fig.23 Europe Market Estimates and Forecast, 2017-2036
Fig.24 U.K.
Fig.25 Germany
Fig.26 France
Fig.27 Italy
Fig.28 Spain
Fig.29 Sweden
Fig.30 Denmark
Fig.31 Norway
Fig.32 The Netherlands
Fig.33 Russia
Fig.34 Asia Pacific
Fig.35 Asia Pacific Market Estimates and Forecast, 2017-2036
Fig.36 China
Fig.37 Japan
Fig.38 India
Fig.39 Australia
Fig.40 South Korea
Fig.41 Thailand
Fig.42 Latin America
Fig.43 Latin America Market Estimates and Forecast, 2017-2036
Fig.44 Brazil
Fig.45 Mexico
Fig.46 Argentina
Fig.47 Colombia
Fig.48 Middle East and Africa
Fig.49 Middle East and Africa Market Estimates and Forecast, 2017-2036
Fig.50 Saudi Arabia
Fig.51 South Africa
Fig.52 UAE
Fig.53 Kuwait
Fig.54 Turkey
Table 1 List of Abbreviation and Acronyms
Table 2 List of Sources
Table 3 North America Computed Tomography (CT) Market, by Segment Analysis, (USD Million) 2017-2036
Table 4 North America Computed Tomography (CT) Market, by Region, (USD Million) 2017-2036
Table 5 U.S. Computed Tomography (CT) Market, by Segment Analysis, (USD Million) 2017-2036
Table 6 Canada Computed Tomography (CT) Market, by Segment Analysis, (USD Million) 2017-2036
Table 7 Europe Computed Tomography (CT) Market, by Segment Analysis, (USD Million) 2017-2036
Table 8 Europe Computed Tomography (CT) Market, by Region, (USD Million) 2017-2036
Table 9 Germany Computed Tomography (CT) Market, by Segment Analysis, (USD Million) 2017-2036
Table 10 U.K. Computed Tomography (CT) Market, by Segment Analysis, (USD Million) 2017-2036
Table 11 France Computed Tomography (CT) Market, by Segment Analysis, (USD Million) 2017-2036
Table 12 Italy Computed Tomography (CT) Market, by Segment Analysis, (USD Million) 2017-2036
Table 13 Spain Computed Tomography (CT) Market, by Segment Analysis, (USD Million) 2017-2036
Table 14 Sweden Computed Tomography (CT) Market, by Segment Analysis, (USD Million) 2017-2036
Table 15 Denmark Computed Tomography (CT) Market, by Segment Analysis, (USD Million) 2017-2036
Table 16 Norway Computed Tomography (CT) Market, by Segment Analysis, (USD Million) 2017-2036
Table 17 The Netherlands Computed Tomography (CT) Market, by Segment Analysis, (USD Million) 2017-2036
Table 18 Russia Computed Tomography (CT) Market, by Segment Analysis, (USD Million) 2017-2036
Table 19 Asia Pacific Global Market, by Segment Analysis, (USD Million) 2017-2036
Table 20 Asia Pacific Computed Tomography (CT) Market, by Region, (USD Million) 2017-2036
Table 21 China Computed Tomography (CT) Market, by Segment Analysis, (USD Million) 2017-2036
Table 22 Japan Computed Tomography (CT) Market, by Segment Analysis, (USD Million) 2017-2036
Table 23 India Computed Tomography (CT) Market, by Segment Analysis, (USD Million) 2017-2036
Table 24 Australia Computed Tomography (CT) Market, by Segment Analysis, (USD Million) 2017-2036
Table 25 South Korea Computed Tomography (CT) Market, by Segment Analysis, (USD Million) 2017-2036
Table 26 Thailand Computed Tomography (CT) Market, by Segment Analysis, (USD Million) 2017-2036
Table 27 Latin America Computed Tomography (CT) Market, by Segment Analysis, (USD Million) 2017-2036
Table 28 Latin America Computed Tomography (CT) Market, by Region, (USD Million) 2017-2036
Table 29 Brazil Computed Tomography (CT) Market, by Segment Analysis, (USD Million) 2017-2036
Table 30 Mexico Computed Tomography (CT) Market, by Segment Analysis, (USD Million) 2017-2036
Table 31 Argentina Computed Tomography (CT) Market, by Segment Analysis, (USD Million) 2017-2036
Table 32 Middle East and Africa Computed Tomography (CT) Market, by Segment Analysis, (USD Million) 2017-2036
Table 33 Middle East and Africa Computed Tomography (CT) Market, by Region, (USD Million) 2017-2036
Table 34 South Africa Computed Tomography (CT) Market, by Segment Analysis, (USD Million) 2017-2036
Table 35 Saudi Arabia Computed Tomography (CT) Market, by Segment Analysis, (USD Million) 2017-2036
Table 36 UAE Computed Tomography (CT) Market, by Segment Analysis, (USD Million) 2017-2036
Table 37 Kuwait Computed Tomography (CT) Market, by Segment Analysis, (USD Million) 2017-2036
Table 38 Turkey Computed Tomography (CT) Market, by Segment Analysis, (USD Million) 2017-2036
Fig.1 Market Research Process
Fig.2 Market Research Approaches
Fig.3 Global Computed Tomography (CT) Market: Market Scenario
Fig.4 Global Computed Tomography (CT) Market Competitive Outlook
Fig.5 Global Computed Tomography (CT) Market Driver Analysis
Fig.6 Global Computed Tomography (CT) Market Restraint Analysis
Fig.7 Global Computed Tomography (CT) Market Opportunity Analysis
Fig.8 Global Computed Tomography (CT) Market Trends Analysis
Fig.9 Global Computed Tomography (CT) Market: Segment Analysis (Based on the Scope)
Fig.10 Global Computed Tomography (CT) Market: Regional Analysis
Fig.11 Global Market Shares and Leading Market Players
Fig.12 North America Market Share and Leading Players
Fig.13 Europe Market Share and Leading Players
Fig.14 Asia Pacific Market Share and Leading Players
Fig.15 Latin America Market Share and Leading Players
Fig.16 Middle East & Africa Market Share and Leading Players
Fig.17 North America, by Country
Fig.18 North America
Fig.19 North America Market Estimates and Forecast, 2017-2036
Fig.20 U.S.
Fig.21 Canada
Fig.22 Europe
Fig.23 Europe Market Estimates and Forecast, 2017-2036
Fig.24 U.K.
Fig.25 Germany
Fig.26 France
Fig.27 Italy
Fig.28 Spain
Fig.29 Sweden
Fig.30 Denmark
Fig.31 Norway
Fig.32 The Netherlands
Fig.33 Russia
Fig.34 Asia Pacific
Fig.35 Asia Pacific Market Estimates and Forecast, 2017-2036
Fig.36 China
Fig.37 Japan
Fig.38 India
Fig.39 Australia
Fig.40 South Korea
Fig.41 Thailand
Fig.42 Latin America
Fig.43 Latin America Market Estimates and Forecast, 2017-2036
Fig.44 Brazil
Fig.45 Mexico
Fig.46 Argentina
Fig.47 Colombia
Fig.48 Middle East and Africa
Fig.49 Middle East and Africa Market Estimates and Forecast, 2017-2036
Fig.50 Saudi Arabia
Fig.51 South Africa
Fig.52 UAE
Fig.53 Kuwait
Fig.54 Turkey
The global Computed Tomography (CT) Market, valued at USD 8.92 billion in 2026, is projected to reach USD 18.42 billion by 2036, registering a CAGR of 7.12% during the forecast period. The market is witnessing significant growth driven by the increasing prevalence of chronic diseases, rising demand for rapid and accurate diagnostic imaging, and continuous technological advancements in computed tomography systems. Growing adoption of artificial intelligence (AI)-enabled image reconstruction, photon-counting CT technology, low-dose imaging solutions, and advanced visualization software is transforming diagnostic workflows while improving clinical outcomes and patient safety. Furthermore, expanding healthcare infrastructure, increasing investments in precision medicine, and the growing need for early disease detection are expected to support sustained market expansion over the forecast period.
Computed Tomography (CT) is a highly advanced diagnostic imaging technology that combines X-ray imaging with sophisticated computer algorithms to produce detailed cross-sectional and three-dimensional images of internal organs, blood vessels, bones, and soft tissues. CT systems play a critical role in diagnosing and monitoring a broad range of medical conditions, including cancer, cardiovascular diseases, neurological disorders, trauma, pulmonary diseases, and musculoskeletal abnormalities. Modern CT scanners incorporate high-speed image acquisition, iterative reconstruction techniques, spectral imaging, AI-assisted diagnostics, automated workflow optimization, and cloud-based image management systems to improve diagnostic accuracy, reduce radiation exposure, and enhance operational efficiency. The growing integration of digital healthcare technologies and precision diagnostics continues to strengthen the clinical importance of CT imaging across hospitals, diagnostic imaging centers, emergency departments, and specialized healthcare facilities worldwide.
The growing burden of chronic diseases, coupled with the increasing need for rapid and accurate diagnosis, continues to drive global demand for computed tomography systems. CT imaging has become one of the most widely utilized diagnostic modalities owing to its ability to deliver high-resolution images within seconds, making it indispensable in emergency medicine, oncology, cardiology, neurology, and trauma care. Continuous technological advancements, including AI-powered image reconstruction, spectral CT, photon-counting detectors, and automated workflow solutions, are improving image quality while reducing radiation exposure and scan times. Furthermore, increasing healthcare investments, expanding hospital infrastructure, and rising awareness regarding preventive healthcare are accelerating CT adoption worldwide.
Despite continuous technological advancements, the high capital investment associated with purchasing, installing, and maintaining advanced CT systems remains a significant barrier, particularly for small hospitals and healthcare facilities in developing economies. Additionally, concerns regarding cumulative radiation exposure from repeated CT examinations continue to influence physician prescribing patterns and patient preference. Regulatory compliance, regular equipment upgrades, and the need for highly skilled radiology professionals further increase the total cost of ownership, limiting broader market penetration.
Rapid advancements in artificial intelligence, deep learning algorithms, and photon-counting detector technology are creating new opportunities for CT manufacturers to improve diagnostic accuracy, automate image interpretation, and enhance workflow efficiency. Growing investments in digital healthcare, cloud-based radiology platforms, and precision medicine are further supporting market expansion. Moreover, increasing healthcare infrastructure development across emerging economies, coupled with rising government investments in diagnostic imaging and preventive healthcare programs, presents substantial long-term growth opportunities for industry participants.
The global CT market is characterized by intense competition among established manufacturers, resulting in pricing pressure, rapid technological innovation, and shorter product replacement cycles. Healthcare providers increasingly demand cost-effective imaging solutions with advanced AI capabilities, forcing manufacturers to continuously invest in research and development while maintaining competitive pricing. Supply chain disruptions, evolving regulatory requirements, reimbursement uncertainties, and increasing cybersecurity risks associated with connected imaging systems may also affect future market growth and profitability.
| Factor | Impact on Computed Tomography (CT) Market |
| Political | Government investments in healthcare infrastructure, expansion of diagnostic imaging facilities, favorable reimbursement policies, and regulatory support for advanced medical imaging technologies continue to drive CT market growth. Public healthcare modernization initiatives across developed and emerging economies are increasing the adoption of advanced CT systems. |
| Economic | Increasing healthcare expenditure, rising investments in hospitals and diagnostic imaging centers, expanding private healthcare sectors, and growing demand for precision diagnostics are supporting market expansion. However, high acquisition, installation, and maintenance costs of advanced CT systems remain major challenges for budget-constrained healthcare providers. |
| Social | The growing prevalence of cancer, cardiovascular diseases, neurological disorders, pulmonary diseases, and trauma cases, along with an aging global population and increasing awareness of early disease diagnosis, continues to accelerate demand for CT imaging worldwide. |
| Technological | Continuous innovations including AI-assisted image reconstruction, photon-counting CT, spectral imaging, low-dose radiation technologies, cloud-based imaging platforms, automated workflow optimization, and advanced visualization software are significantly improving diagnostic accuracy and operational efficiency. |
| Legal | Strict regulatory approvals from agencies such as the FDA, CE, and other national regulatory authorities ensure product quality, patient safety, cybersecurity compliance, radiation safety standards, and clinical effectiveness before commercialization. |
| Environmental | Manufacturers are increasingly focusing on energy-efficient CT systems, environmentally sustainable manufacturing, reduced power consumption, recyclable components, and eco-friendly product lifecycle management to support global sustainability initiatives. |
| Porter's Five Forces | Analysis |
| Threat of New Entrants | Low – High capital investment, extensive research & development requirements, stringent regulatory approvals, advanced manufacturing capabilities, and strong brand recognition create substantial entry barriers for new market participants. |
| Bargaining Power of Suppliers | Moderate – Suppliers of X-ray tubes, detectors, semiconductors, AI software, and advanced imaging components possess moderate bargaining power due to technological specialization. However, major CT manufacturers maintain diversified global supply chains to reduce procurement risks. |
| Bargaining Power of Buyers | Moderate to High – Large hospital networks, diagnostic imaging chains, and healthcare systems possess significant negotiating power because of bulk purchasing, competitive bidding, and availability of multiple established CT equipment manufacturers. |
| Threat of Substitutes | Moderate – MRI, ultrasound, PET, X-ray, and nuclear imaging serve as alternative diagnostic modalities for selected clinical applications. However, CT remains the preferred imaging technology for emergency medicine, trauma imaging, lung assessment, vascular imaging, and rapid whole-body diagnosis. |
| Competitive Rivalry | High – The global CT market is highly competitive, with leading manufacturers focusing on AI-powered imaging, photon-counting CT, low-dose imaging technologies, workflow automation, strategic partnerships, product innovation, mergers & acquisitions, and global expansion to strengthen their competitive position. |
The global Computed Tomography (CT) Market is segmented based on Product Type, Application, and End User.
Based on product type, the Computed Tomography (CT) market is segmented into Low-Slice CT Systems, Mid-Slice CT Systems, and High-Slice CT Systems.
High-Slice CT Systems represent the largest revenue-generating segment of the global Computed Tomography market due to their superior imaging capabilities, rapid scan speeds, and exceptional diagnostic accuracy. These systems, including 128-slice, 256-slice, and 320-slice CT scanners, are extensively utilized for complex clinical applications such as cardiovascular imaging, oncology, neurology, trauma diagnosis, and emergency medicine. Their ability to produce high-resolution three-dimensional images while significantly reducing motion artifacts makes them indispensable for modern healthcare facilities.
Continuous technological innovations including artificial intelligence-assisted image reconstruction, spectral CT imaging, photon-counting detectors, iterative reconstruction algorithms, and ultra-low-dose imaging have further enhanced clinical performance while improving patient safety and operational efficiency. Large tertiary hospitals and advanced diagnostic imaging centers continue investing in high-slice CT systems to support precision diagnostics, image-guided interventions, and comprehensive disease management.
Mid-Slice CT Systems continue to experience strong market growth owing to their optimal balance between diagnostic performance and cost-effectiveness. These systems are widely adopted by multispecialty hospitals, regional healthcare facilities, and independent diagnostic imaging centers for routine neurological, thoracic, abdominal, orthopedic, and vascular examinations.
Growing healthcare investments across emerging economies, expanding diagnostic imaging infrastructure, and increasing demand for affordable advanced imaging technologies are driving adoption. Furthermore, improvements in detector efficiency, AI-powered workflow optimization, and dose reduction technologies continue to improve diagnostic accuracy while maintaining competitive operating costs.
Low-Slice CT Systems remain important for routine diagnostic imaging, particularly in community hospitals, rural healthcare facilities, and resource-constrained healthcare settings. These systems provide reliable imaging for trauma assessment, pulmonary examinations, orthopedic imaging, and general diagnostic applications while requiring lower capital investment and maintenance costs.
Although technological limitations compared to high-slice systems restrict their use in advanced cardiac and neurological imaging, continued modernization programs and healthcare expansion initiatives in developing countries continue supporting demand for low-slice CT systems.
Based on application, the Computed Tomography (CT) market is segmented into Oncology, Cardiology, and Neurology.
Oncology represents the largest application segment within the global CT market due to the increasing global incidence of cancer and growing demand for early disease diagnosis. CT imaging plays a critical role throughout the oncology care pathway, including tumor detection, disease staging, treatment planning, radiation therapy guidance, biopsy planning, therapeutic response assessment, and recurrence monitoring.
Advanced technologies including spectral CT, AI-assisted lesion detection, automated tumor segmentation, and three-dimensional visualization continue improving diagnostic confidence and clinical decision-making. The growing emphasis on precision oncology and personalized medicine is further increasing investments in next-generation CT imaging systems across cancer centers worldwide.
Cardiology is expected to witness the fastest growth during the forecast period owing to the increasing prevalence of cardiovascular diseases and growing adoption of coronary CT angiography (CCTA). Modern CT scanners enable rapid non-invasive visualization of coronary arteries, cardiac anatomy, myocardial perfusion, structural heart disease, and vascular abnormalities with excellent spatial resolution.
Continuous innovations in high-speed detectors, dual-source CT, AI-assisted cardiac analysis, and ultra-low radiation imaging are significantly improving diagnostic performance while expanding clinical applications across preventive cardiology and cardiovascular risk assessment.
Neurology remains one of the most important applications for CT imaging, particularly in emergency medicine where rapid diagnosis is essential. CT scanners are routinely utilized for stroke diagnosis, traumatic brain injuries, intracranial hemorrhage, brain tumors, hydrocephalus, and neurovascular disorders.
The increasing incidence of stroke worldwide, combined with expanding emergency healthcare infrastructure and faster imaging technologies, continues driving CT utilization in neurological care. AI-powered stroke detection and automated hemorrhage identification software are further enhancing diagnostic speed and treatment outcomes.
Based on End User, the Computed Tomography (CT) market is segmented into Hospitals, Diagnostic Imaging Centers, and Academic & Research Institutes.
Hospitals account for the largest share of the global CT market owing to their high patient volumes, advanced diagnostic capabilities, and comprehensive healthcare services. CT systems are extensively utilized across emergency departments, trauma centers, oncology units, cardiovascular departments, neurological centers, and intensive care units.
Growing investments in hospital modernization, digital radiology, AI-enabled diagnostic platforms, and precision medicine continue driving procurement of next-generation CT scanners. Large healthcare organizations increasingly invest in high-performance CT systems capable of supporting multiple specialties while improving workflow efficiency and patient throughput.
Diagnostic Imaging Centers are expected to register the fastest growth throughout the forecast period due to increasing demand for outpatient diagnostic services, shorter waiting times, and cost-effective imaging solutions. These facilities perform large volumes of routine CT examinations for oncology, cardiology, orthopedics, pulmonary diseases, and preventive health screening.
The continued shift toward outpatient healthcare delivery, increasing healthcare accessibility, and expansion of independent imaging facilities are expected to support long-term market growth.
Academic and Research Institutes play an essential role in advancing CT imaging technologies through clinical research, product development, medical education, and innovation. These organizations actively evaluate emerging technologies including photon-counting CT, AI-assisted diagnostics, low-dose imaging protocols, spectral CT, and advanced image reconstruction algorithms.
Collaborative research between universities, hospitals, medical device manufacturers, and government institutions continues accelerating technological innovation while supporting future commercialization of next-generation CT imaging systems.
Based on geography, the Computed Tomography (CT) Market is segmented into North America, Europe, Asia Pacific, Latin America, and the Middle East & Africa.
Our updated report version includes a comprehensive regional scope chapter covering 5 major regions and 27+ countries, providing in-depth analysis of market size, growth forecasts, competitive landscape, healthcare infrastructure, regulatory environment, technological advancements, and country-level growth opportunities.
The report provides detailed coverage of:
This extensive regional coverage enables stakeholders to evaluate country-level demand, healthcare investments, reimbursement landscape, competitive positioning, technological adoption, regulatory developments, and future growth opportunities, supporting informed strategic planning and business expansion decisions.
North America accounts for the largest share of the global Computed Tomography (CT) market, supported by its highly developed healthcare infrastructure, widespread adoption of advanced diagnostic imaging technologies, and substantial healthcare expenditure. The United States remains the dominant contributor owing to the presence of leading medical imaging manufacturers, favorable reimbursement frameworks, and continuous investments in precision diagnostics and digital healthcare transformation. Hospitals and diagnostic imaging centers across the region are rapidly adopting next-generation CT systems incorporating artificial intelligence (AI), photon-counting detector technology, low-dose imaging protocols, and advanced visualization software to improve diagnostic accuracy and operational efficiency.
The increasing prevalence of cancer, cardiovascular diseases, neurological disorders, pulmonary diseases, and traumatic injuries continues to drive demand for CT imaging across emergency departments, oncology centers, and specialty hospitals. Furthermore, ongoing replacement of conventional CT systems with high-performance scanners, increasing investments in cloud-based imaging platforms, and expanding research collaborations between healthcare institutions and technology providers are expected to sustain North America's leadership throughout the forecast period.
Europe represents a mature and technologically advanced Computed Tomography market, driven by well-established healthcare systems, favorable government healthcare spending, and continuous modernization of diagnostic imaging infrastructure. Countries including Germany, the United Kingdom, France, Italy, Spain, and the Nordic nations continue investing in advanced CT scanners featuring AI-assisted image reconstruction, spectral imaging, and low-dose radiation technologies to improve diagnostic quality while enhancing patient safety.
The growing aging population, increasing burden of chronic diseases, and expanding demand for preventive healthcare are supporting the widespread utilization of CT imaging across hospitals and outpatient diagnostic facilities. In addition, strong regulatory standards, increasing adoption of precision medicine, expanding clinical research activities, and ongoing technological innovation by leading manufacturers continue to strengthen Europe's position as one of the world's largest CT imaging markets.
Asia Pacific is projected to register the fastest growth during the forecast period owing to rapid healthcare infrastructure development, increasing healthcare expenditure, expanding hospital networks, and rising awareness regarding early disease diagnosis. Major economies including China, India, Japan, South Korea, Australia, and Southeast Asian countries continue investing heavily in advanced diagnostic imaging technologies to address the increasing burden of chronic diseases and improve healthcare accessibility.
Government initiatives supporting healthcare modernization, increasing medical insurance coverage, growing medical tourism, and rising disposable incomes are accelerating the installation of advanced CT systems across hospitals and diagnostic imaging centers. Furthermore, the growing adoption of AI-enabled imaging solutions, digital radiology platforms, and cost-effective multi-slice CT scanners presents significant opportunities for both global and regional manufacturers. Expanding manufacturing capabilities and strategic investments by leading imaging companies are expected to further support long-term regional market growth.
The Latin American Computed Tomography market is experiencing steady growth, supported by improving healthcare infrastructure, increasing government healthcare investments, and expanding access to advanced diagnostic imaging services. Countries including Brazil, Mexico, Argentina, Chile, and Colombia continue modernizing hospital infrastructure while increasing procurement of advanced CT imaging systems to improve disease diagnosis and emergency healthcare services.
The increasing prevalence of cardiovascular diseases, cancer, respiratory disorders, and trauma cases is driving greater utilization of CT imaging across public and private healthcare facilities. Growing private healthcare investments, expansion of independent diagnostic imaging centers, and increasing awareness regarding preventive health screening are expected to further strengthen market demand. Although high equipment costs and uneven healthcare accessibility remain challenges, ongoing healthcare reforms and improving reimbursement systems continue creating favorable growth opportunities.
The Middle East & Africa Computed Tomography market is gradually expanding due to increasing investments in healthcare infrastructure, modernization of public hospitals, and growing adoption of advanced diagnostic imaging technologies. Countries including Saudi Arabia, the United Arab Emirates, Qatar, Kuwait, South Africa, and Egypt are investing significantly in healthcare digitalization, specialty hospitals, and advanced medical imaging equipment to improve diagnostic capabilities.
The rising burden of chronic diseases, expanding private healthcare sector, growing medical tourism, and increasing government initiatives aimed at strengthening healthcare delivery continue to support CT market growth across the region. Additionally, ongoing investments in artificial intelligence-enabled imaging, emergency healthcare services, and diagnostic center expansion are creating new opportunities for market participants. Although disparities in healthcare accessibility and limited availability of advanced imaging infrastructure persist in several developing countries, increasing public-private partnerships and foreign investments are expected to drive long-term market expansion throughout the forecast period.
The global Computed Tomography (CT) Market is highly competitive and moderately consolidated, with leading multinational companies competing through continuous technological innovation, product portfolio expansion, artificial intelligence (AI)-enabled imaging solutions, and strategic partnerships. Market participants are focused on developing next-generation CT systems that deliver superior image quality, faster scan times, reduced radiation exposure, and improved workflow efficiency to meet the growing demand for precision diagnostics and value-based healthcare.
Competition is primarily based on technological capabilities, detector performance, image reconstruction software, AI integration, product reliability, pricing strategies, regulatory approvals, service support, and global distribution networks. Manufacturers are also investing significantly in research & development (R&D), cloud-based imaging platforms, photon-counting CT technology, spectral imaging, and digital healthcare solutions to strengthen their competitive positioning. Furthermore, companies continue expanding their manufacturing capabilities and regional presence through mergers & acquisitions, strategic collaborations, and healthcare partnerships to capture emerging market opportunities.
Leading companies operating in the Computed Tomography (CT) market are actively pursuing several strategic initiatives to strengthen their market position and accelerate long-term growth. Key strategies include:
The competitive landscape is expected to remain dynamic throughout the forecast period as companies continue to invest in advanced imaging technologies, digital transformation, strategic collaborations, and geographic expansion to capitalize on the growing global demand for high-performance computed tomography systems.
| Report Scope | Details |
| Report Version | 2026 |
| Growth Rate | CAGR of 7.12 % from 2026 to 2036 |
| Base Year | 2025 |
| Actual Estimates / Historical Data | 2017 - 2024 |
| Forecast Period | 2026 - 2036 |
| Quantitative Units | Revenue in USD million/billion & CAGR from 2026 to 2036 |
| Country Scope | North America (U.S., Canada), Europe (UK, Germany, France, Italy, Spain, Russia, Sweden, Denmark, Norway, Rest of Europe), Asia Pacific (Japan, China, India, Australia, South Korea, Thailand, Rest of Asia Pacific), Latin America (Brazil, Mexico, Argentina, Colombia, Rest of Latin America), Middle East & Africa (South Africa, Saudi Arabia, UAE, Kuwait, Rest of Middle East & Africa). |
| The Segment Covered by Product Type |
|
| The Segment Covered by Technology |
|
| Companies Covered |
|
| Report Coverage | Revenue forecast, company share, competitive landscape, growth factors, technology trends, and regional analysis |
| Free Customization Scope (Equivalent to 5 Analyst Working Days) | If you require additional insights beyond the current scope, our analysts can customize the report to meet your specific business needs. |
Prepared by: Shivani Patil
Designation: Senior Healthcare & Medical Devices Research Analyst
Organization: Quintile Reports
Shivani Patil is a Senior Healthcare & Medical Devices Research Analyst at Quintile Reports, with extensive expertise in diagnostic imaging, medical devices, life sciences, digital health, and healthcare technologies. She specializes in analyzing emerging market trends, technological innovations, competitive landscapes, regulatory developments, and investment opportunities across the global healthcare industry.
With significant experience in syndicated and custom market research, Shivani has authored numerous studies covering diagnostic imaging modalities, including Computed Tomography (CT), Magnetic Resonance Imaging (MRI), Ultrasound, X-ray Imaging, Nuclear Imaging, and Artificial Intelligence in Medical Imaging. Her expertise encompasses market sizing, forecasting, competitive intelligence, value chain analysis, market dynamics, and strategic business insights, enabling organizations to make informed investment and expansion decisions.
At Quintile Reports, Shivani leverages comprehensive primary research, extensive secondary research, and advanced analytical methodologies to deliver accurate, reliable, and actionable market intelligence. Her research supports medical device manufacturers, healthcare providers, investors, distributors, policymakers, and technology companies in identifying growth opportunities, evaluating competitive strategies, and navigating the evolving global diagnostic imaging market.
Table 1 List of Abbreviation and Acronyms
Table 2 List of Sources
Table 3 North America Computed Tomography (CT) Market, by Segment Analysis, (USD Million) 2017-2036
Table 4 North America Computed Tomography (CT) Market, by Region, (USD Million) 2017-2036
Table 5 U.S. Computed Tomography (CT) Market, by Segment Analysis, (USD Million) 2017-2036
Table 6 Canada Computed Tomography (CT) Market, by Segment Analysis, (USD Million) 2017-2036
Table 7 Europe Computed Tomography (CT) Market, by Segment Analysis, (USD Million) 2017-2036
Table 8 Europe Computed Tomography (CT) Market, by Region, (USD Million) 2017-2036
Table 9 Germany Computed Tomography (CT) Market, by Segment Analysis, (USD Million) 2017-2036
Table 10 U.K. Computed Tomography (CT) Market, by Segment Analysis, (USD Million) 2017-2036
Table 11 France Computed Tomography (CT) Market, by Segment Analysis, (USD Million) 2017-2036
Table 12 Italy Computed Tomography (CT) Market, by Segment Analysis, (USD Million) 2017-2036
Table 13 Spain Computed Tomography (CT) Market, by Segment Analysis, (USD Million) 2017-2036
Table 14 Sweden Computed Tomography (CT) Market, by Segment Analysis, (USD Million) 2017-2036
Table 15 Denmark Computed Tomography (CT) Market, by Segment Analysis, (USD Million) 2017-2036
Table 16 Norway Computed Tomography (CT) Market, by Segment Analysis, (USD Million) 2017-2036
Table 17 The Netherlands Computed Tomography (CT) Market, by Segment Analysis, (USD Million) 2017-2036
Table 18 Russia Computed Tomography (CT) Market, by Segment Analysis, (USD Million) 2017-2036
Table 19 Asia Pacific Global Market, by Segment Analysis, (USD Million) 2017-2036
Table 20 Asia Pacific Computed Tomography (CT) Market, by Region, (USD Million) 2017-2036
Table 21 China Computed Tomography (CT) Market, by Segment Analysis, (USD Million) 2017-2036
Table 22 Japan Computed Tomography (CT) Market, by Segment Analysis, (USD Million) 2017-2036
Table 23 India Computed Tomography (CT) Market, by Segment Analysis, (USD Million) 2017-2036
Table 24 Australia Computed Tomography (CT) Market, by Segment Analysis, (USD Million) 2017-2036
Table 25 South Korea Computed Tomography (CT) Market, by Segment Analysis, (USD Million) 2017-2036
Table 26 Thailand Computed Tomography (CT) Market, by Segment Analysis, (USD Million) 2017-2036
Table 27 Latin America Computed Tomography (CT) Market, by Segment Analysis, (USD Million) 2017-2036
Table 28 Latin America Computed Tomography (CT) Market, by Region, (USD Million) 2017-2036
Table 29 Brazil Computed Tomography (CT) Market, by Segment Analysis, (USD Million) 2017-2036
Table 30 Mexico Computed Tomography (CT) Market, by Segment Analysis, (USD Million) 2017-2036
Table 31 Argentina Computed Tomography (CT) Market, by Segment Analysis, (USD Million) 2017-2036
Table 32 Middle East and Africa Computed Tomography (CT) Market, by Segment Analysis, (USD Million) 2017-2036
Table 33 Middle East and Africa Computed Tomography (CT) Market, by Region, (USD Million) 2017-2036
Table 34 South Africa Computed Tomography (CT) Market, by Segment Analysis, (USD Million) 2017-2036
Table 35 Saudi Arabia Computed Tomography (CT) Market, by Segment Analysis, (USD Million) 2017-2036
Table 36 UAE Computed Tomography (CT) Market, by Segment Analysis, (USD Million) 2017-2036
Table 37 Kuwait Computed Tomography (CT) Market, by Segment Analysis, (USD Million) 2017-2036
Table 38 Turkey Computed Tomography (CT) Market, by Segment Analysis, (USD Million) 2017-2036
Fig.1 Market Research Process
Fig.2 Market Research Approaches
Fig.3 Global Computed Tomography (CT) Market: Market Scenario
Fig.4 Global Computed Tomography (CT) Market Competitive Outlook
Fig.5 Global Computed Tomography (CT) Market Driver Analysis
Fig.6 Global Computed Tomography (CT) Market Restraint Analysis
Fig.7 Global Computed Tomography (CT) Market Opportunity Analysis
Fig.8 Global Computed Tomography (CT) Market Trends Analysis
Fig.9 Global Computed Tomography (CT) Market: Segment Analysis (Based on the Scope)
Fig.10 Global Computed Tomography (CT) Market: Regional Analysis
Fig.11 Global Market Shares and Leading Market Players
Fig.12 North America Market Share and Leading Players
Fig.13 Europe Market Share and Leading Players
Fig.14 Asia Pacific Market Share and Leading Players
Fig.15 Latin America Market Share and Leading Players
Fig.16 Middle East & Africa Market Share and Leading Players
Fig.17 North America, by Country
Fig.18 North America
Fig.19 North America Market Estimates and Forecast, 2017-2036
Fig.20 U.S.
Fig.21 Canada
Fig.22 Europe
Fig.23 Europe Market Estimates and Forecast, 2017-2036
Fig.24 U.K.
Fig.25 Germany
Fig.26 France
Fig.27 Italy
Fig.28 Spain
Fig.29 Sweden
Fig.30 Denmark
Fig.31 Norway
Fig.32 The Netherlands
Fig.33 Russia
Fig.34 Asia Pacific
Fig.35 Asia Pacific Market Estimates and Forecast, 2017-2036
Fig.36 China
Fig.37 Japan
Fig.38 India
Fig.39 Australia
Fig.40 South Korea
Fig.41 Thailand
Fig.42 Latin America
Fig.43 Latin America Market Estimates and Forecast, 2017-2036
Fig.44 Brazil
Fig.45 Mexico
Fig.46 Argentina
Fig.47 Colombia
Fig.48 Middle East and Africa
Fig.49 Middle East and Africa Market Estimates and Forecast, 2017-2036
Fig.50 Saudi Arabia
Fig.51 South Africa
Fig.52 UAE
Fig.53 Kuwait
Fig.54 Turkey
Table 1 List of Abbreviation and Acronyms
Table 2 List of Sources
Table 3 North America Computed Tomography (CT) Market, by Segment Analysis, (USD Million) 2017-2036
Table 4 North America Computed Tomography (CT) Market, by Region, (USD Million) 2017-2036
Table 5 U.S. Computed Tomography (CT) Market, by Segment Analysis, (USD Million) 2017-2036
Table 6 Canada Computed Tomography (CT) Market, by Segment Analysis, (USD Million) 2017-2036
Table 7 Europe Computed Tomography (CT) Market, by Segment Analysis, (USD Million) 2017-2036
Table 8 Europe Computed Tomography (CT) Market, by Region, (USD Million) 2017-2036
Table 9 Germany Computed Tomography (CT) Market, by Segment Analysis, (USD Million) 2017-2036
Table 10 U.K. Computed Tomography (CT) Market, by Segment Analysis, (USD Million) 2017-2036
Table 11 France Computed Tomography (CT) Market, by Segment Analysis, (USD Million) 2017-2036
Table 12 Italy Computed Tomography (CT) Market, by Segment Analysis, (USD Million) 2017-2036
Table 13 Spain Computed Tomography (CT) Market, by Segment Analysis, (USD Million) 2017-2036
Table 14 Sweden Computed Tomography (CT) Market, by Segment Analysis, (USD Million) 2017-2036
Table 15 Denmark Computed Tomography (CT) Market, by Segment Analysis, (USD Million) 2017-2036
Table 16 Norway Computed Tomography (CT) Market, by Segment Analysis, (USD Million) 2017-2036
Table 17 The Netherlands Computed Tomography (CT) Market, by Segment Analysis, (USD Million) 2017-2036
Table 18 Russia Computed Tomography (CT) Market, by Segment Analysis, (USD Million) 2017-2036
Table 19 Asia Pacific Global Market, by Segment Analysis, (USD Million) 2017-2036
Table 20 Asia Pacific Computed Tomography (CT) Market, by Region, (USD Million) 2017-2036
Table 21 China Computed Tomography (CT) Market, by Segment Analysis, (USD Million) 2017-2036
Table 22 Japan Computed Tomography (CT) Market, by Segment Analysis, (USD Million) 2017-2036
Table 23 India Computed Tomography (CT) Market, by Segment Analysis, (USD Million) 2017-2036
Table 24 Australia Computed Tomography (CT) Market, by Segment Analysis, (USD Million) 2017-2036
Table 25 South Korea Computed Tomography (CT) Market, by Segment Analysis, (USD Million) 2017-2036
Table 26 Thailand Computed Tomography (CT) Market, by Segment Analysis, (USD Million) 2017-2036
Table 27 Latin America Computed Tomography (CT) Market, by Segment Analysis, (USD Million) 2017-2036
Table 28 Latin America Computed Tomography (CT) Market, by Region, (USD Million) 2017-2036
Table 29 Brazil Computed Tomography (CT) Market, by Segment Analysis, (USD Million) 2017-2036
Table 30 Mexico Computed Tomography (CT) Market, by Segment Analysis, (USD Million) 2017-2036
Table 31 Argentina Computed Tomography (CT) Market, by Segment Analysis, (USD Million) 2017-2036
Table 32 Middle East and Africa Computed Tomography (CT) Market, by Segment Analysis, (USD Million) 2017-2036
Table 33 Middle East and Africa Computed Tomography (CT) Market, by Region, (USD Million) 2017-2036
Table 34 South Africa Computed Tomography (CT) Market, by Segment Analysis, (USD Million) 2017-2036
Table 35 Saudi Arabia Computed Tomography (CT) Market, by Segment Analysis, (USD Million) 2017-2036
Table 36 UAE Computed Tomography (CT) Market, by Segment Analysis, (USD Million) 2017-2036
Table 37 Kuwait Computed Tomography (CT) Market, by Segment Analysis, (USD Million) 2017-2036
Table 38 Turkey Computed Tomography (CT) Market, by Segment Analysis, (USD Million) 2017-2036
Fig.1 Market Research Process
Fig.2 Market Research Approaches
Fig.3 Global Computed Tomography (CT) Market: Market Scenario
Fig.4 Global Computed Tomography (CT) Market Competitive Outlook
Fig.5 Global Computed Tomography (CT) Market Driver Analysis
Fig.6 Global Computed Tomography (CT) Market Restraint Analysis
Fig.7 Global Computed Tomography (CT) Market Opportunity Analysis
Fig.8 Global Computed Tomography (CT) Market Trends Analysis
Fig.9 Global Computed Tomography (CT) Market: Segment Analysis (Based on the Scope)
Fig.10 Global Computed Tomography (CT) Market: Regional Analysis
Fig.11 Global Market Shares and Leading Market Players
Fig.12 North America Market Share and Leading Players
Fig.13 Europe Market Share and Leading Players
Fig.14 Asia Pacific Market Share and Leading Players
Fig.15 Latin America Market Share and Leading Players
Fig.16 Middle East & Africa Market Share and Leading Players
Fig.17 North America, by Country
Fig.18 North America
Fig.19 North America Market Estimates and Forecast, 2017-2036
Fig.20 U.S.
Fig.21 Canada
Fig.22 Europe
Fig.23 Europe Market Estimates and Forecast, 2017-2036
Fig.24 U.K.
Fig.25 Germany
Fig.26 France
Fig.27 Italy
Fig.28 Spain
Fig.29 Sweden
Fig.30 Denmark
Fig.31 Norway
Fig.32 The Netherlands
Fig.33 Russia
Fig.34 Asia Pacific
Fig.35 Asia Pacific Market Estimates and Forecast, 2017-2036
Fig.36 China
Fig.37 Japan
Fig.38 India
Fig.39 Australia
Fig.40 South Korea
Fig.41 Thailand
Fig.42 Latin America
Fig.43 Latin America Market Estimates and Forecast, 2017-2036
Fig.44 Brazil
Fig.45 Mexico
Fig.46 Argentina
Fig.47 Colombia
Fig.48 Middle East and Africa
Fig.49 Middle East and Africa Market Estimates and Forecast, 2017-2036
Fig.50 Saudi Arabia
Fig.51 South Africa
Fig.52 UAE
Fig.53 Kuwait
Fig.54 Turkey

A license granted to one user. Rules or conditions might be applied for e.g. the use of electric files (PDFs) or printings, depending on product.
A license granted to multiple users.
A license granted to a single business site/establishment.
A license granted to all employees within organisation access to the product.
Immediate / Within 24-48 hours - Working days
Online Payments with PayPal and CCavenue
You can order a report by picking any of the payment methods which is bank wire or online payment through any Debit/Credit card or PayPal.
Hard Copy
Radiology Information System (RIS) Market Overview The global Radiology Information System (RIS) Mar
Read MoreTeleradiology Market Overview Report Description The global Teleradiology Market was valued at USD 7
Read MoreMagnetic Resonance Imaging (MRI) Market Overview The global Magnetic Resonance Imaging (MRI) Market,
Read More