The global Point-of-Use (POU) Water Treatment Systems Market was valued at USD 36.51 billion in 2026 and is projected to reach USD 98.06 billion by 2036, registering a robust CAGR of 9.89% during the forecast period. The market is experiencing strong growth due to rising concerns regarding water contamination, increasing consumer awareness about health and hygiene, and growing demand for decentralized water purification solutions. Point-of-use systems provide immediate access to safe drinking water through advanced technologies such as reverse osmosis, ultrafiltration, activated carbon filtration, and ultraviolet disinfection, making them increasingly popular across residential, commercial, and institutional settings.
The market is further benefiting from rapid urbanization, aging water infrastructure, increasing prevalence of waterborne diseases, and rising environmental concerns associated with bottled water consumption. Technological advancements including smart monitoring systems, IoT-enabled filtration devices, and energy-efficient purification technologies are also enhancing consumer adoption. As governments and public health organizations continue to emphasize safe drinking water access, the demand for advanced point-of-use treatment systems is expected to accelerate significantly over the coming decade.

The market is benefiting from a combination of public health awareness, urbanization, and innovation in water treatment technologies. Consumers are increasingly seeking localized purification systems capable of removing contaminants while providing convenient access to clean drinking water. Advanced purification technologies such as multi-stage reverse osmosis systems, UV purification, ultrafiltration membranes, and activated carbon filters are becoming more widely adopted due to their effectiveness and reliability.
The integration of IoT-enabled monitoring systems, real-time water quality tracking, automated maintenance alerts, and smart-home compatibility is further transforming the competitive landscape. Manufacturers are introducing compact, energy-efficient, and user-friendly systems designed to meet the evolving preferences of modern consumers. As governments and public health organizations continue emphasizing safe drinking water access, demand for innovative POU treatment solutions is expected to strengthen globally.

North America represents a mature and technologically advanced market driven by increasing consumer awareness regarding contaminants such as PFAS, lead, and other emerging pollutants. Growing concerns surrounding aging water infrastructure and water quality reliability have encouraged widespread adoption of under-sink reverse osmosis systems, activated carbon filters, and smart purification technologies. Strong regulatory oversight and high consumer purchasing power continue to support market growth across the United States and Canada.
Europe maintains steady growth supported by stringent drinking water regulations, environmental sustainability initiatives, and growing consumer preference for eco-friendly alternatives to bottled water. Countries such as Germany, France, and the United Kingdom are witnessing increasing adoption of advanced filtration systems, particularly those designed to reduce plastic waste while maintaining high water quality standards. The region is also experiencing growing demand for digitally connected purification solutions capable of monitoring filtration performance and water quality in real time.
Asia-Pacific remains the largest and fastest-growing regional market due to rapid urbanization, industrialization, and rising concerns regarding water pollution. Countries including China, India, Japan, and several Southeast Asian nations continue to experience strong demand for residential and commercial water purification systems. Government initiatives focused on improving public health and water access are further supporting market expansion. Rising disposable incomes and increasing health consciousness among consumers are accelerating adoption of advanced filtration technologies throughout the region.
Latin America is witnessing gradual market growth as urban populations expand and concerns regarding waterborne diseases increase. Affordable filtration systems, including faucet-mounted and countertop solutions, are gaining popularity among consumers seeking cost-effective water treatment options. Meanwhile, the Middle East and Africa continue to experience growing demand due to water scarcity challenges, infrastructure limitations, and increasing awareness regarding safe drinking water solutions. Advanced reverse osmosis systems are particularly popular in Gulf countries, while cost-effective filtration technologies are widely adopted across developing markets.

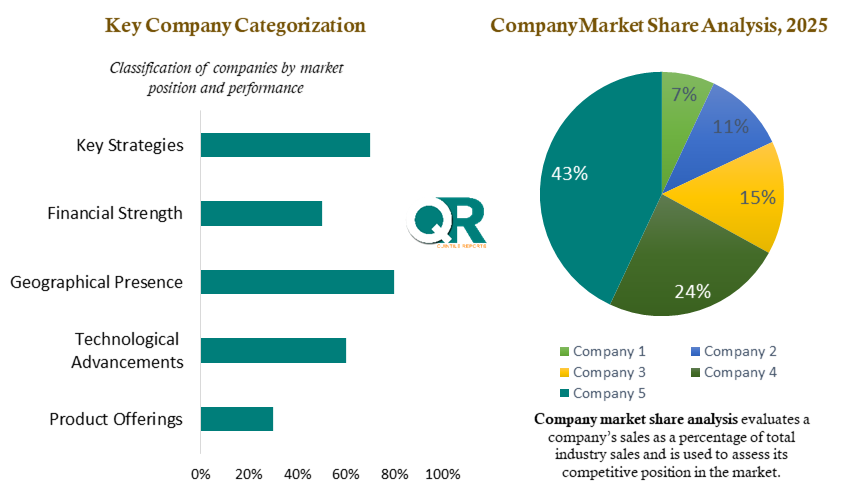
The Point-of-Use Water Treatment Systems Market is highly competitive, with leading manufacturers competing through technological innovation, product performance, affordability, and brand reputation. Companies are focusing on developing advanced purification systems that combine multiple treatment technologies, including reverse osmosis, ultraviolet disinfection, activated carbon filtration, and ultrafiltration membranes, to enhance water quality and consumer confidence.
Smart water treatment solutions are becoming a major differentiator within the industry. Manufacturers are integrating digital monitoring systems, IoT-enabled sensors, predictive maintenance alerts, and smartphone connectivity to improve user experience and system efficiency. Product customization based on regional water quality conditions is also emerging as an important competitive strategy.
Additionally, sustainability considerations are influencing product development, with companies introducing energy-efficient systems, recyclable components, and solutions designed to reduce plastic bottle consumption. Strong after-sales service, filter replacement programs, certification compliance, and consumer trust remain critical factors influencing market leadership and long-term customer retention.
| Report Scope | Details |
| Report Version | 2026 |
| Growth Rate | CAGR of 9.89 % from 2026 to 2036 |
| Base Year | 2025 |
| Actual Estimates / Historical Data | 2017 - 2024 |
| Forecast Period | 2026 - 2036 |
| Quantitative Units | Revenue in USD million/billion & CAGR from 2026 to 2036 |
| Country Scope | North America (U.S., Canada), Europe (UK, Germany, France, Italy, Spain, Russia, Sweden, Denmark, Norway, Rest of Europe), Asia Pacific (Japan, China, India, Australia, South Korea, Thailand, Rest of Asia Pacific), Latin America (Brazil, Mexico, Argentina, Colombia, Rest of Latin America), Middle East & Africa (South Africa, Saudi Arabia, UAE, Kuwait, Rest of Middle East & Africa). |
| The Segment Covered by Technology |
|
| The Segment Covered by Device Type |
|
| Companies Covered |
|
| Report Coverage | Revenue forecast, company share, competitive landscape, growth factors, technology trends, and regional analysis |
| Free Customization Scope (Equivalent to 5 Analyst Working Days) | If you require additional insights beyond the current scope, our analysts can customize the report to meet your specific business needs. |
This report is developed using a comprehensive research framework designed to provide accurate, reliable, and actionable market intelligence. The analysis incorporates extensive primary research with industry stakeholders, manufacturers, distributors, technology providers, and water treatment specialists, combined with detailed secondary research from credible industry publications, government agencies, regulatory organizations, and company disclosures.
Each market estimate undergoes rigorous validation through data triangulation, trend analysis, and expert review processes to ensure consistency and accuracy. The report delivers objective insights into market dynamics, competitive developments, emerging technologies, and future growth opportunities, enabling stakeholders to make informed strategic decisions with confidence.
The research methodology combines both qualitative and quantitative approaches to provide a holistic assessment of the Point-of-Use Water Treatment Systems Market. Secondary research forms the foundation of the analysis and includes evaluation of industry reports, corporate filings, water quality studies, regulatory frameworks, trade publications, and market databases.
Primary research consists of interviews with senior executives, product managers, distributors, water treatment experts, and industry consultants. Insights gathered from these discussions are used to validate market assumptions, identify emerging trends, and assess future growth potential. Advanced forecasting models, market sizing techniques, regional demand analysis, and data triangulation methodologies are applied to generate accurate market projections and strategic insights.

This report has been prepared by a team of experienced market researchers, environmental technology analysts, and water treatment industry specialists with extensive expertise in global water infrastructure and purification technologies. The research team combines deep industry knowledge with advanced analytical methodologies to deliver reliable, objective, and actionable market intelligence.
Through continuous monitoring of regulatory developments, technological advancements, consumer preferences, and competitive activities, our analysts provide stakeholders with valuable insights into market evolution and future growth opportunities. This commitment to research excellence, transparency, and analytical rigor ensures that the report serves as a trusted resource for manufacturers, investors, distributors, policymakers, and water treatment solution providers worldwide.
List of Tables
Table 1 List of Abbreviation and acronyms
Table 2 List of Sources
Table 3 North America Global India Outdoor Air Pollution Control Market, by Segment Analysis, (USD Million) 2017-2036
Table 4 North America Global India Outdoor Air Pollution Control Market, by Region, (USD Million) 2017-2036
Table 5 U.S. Global India Outdoor Air Pollution Control Market, by Segment Analysis, (USD Million) 2017-2036
Table 6 Canada Global India Outdoor Air Pollution Control Market, by Segment Analysis, (USD Million) 2017-2036
Table 7 Europe Global India Outdoor Air Pollution Control Market, by Segment Analysis, (USD Million) 2017-2036
Table 8 Europe Global India Outdoor Air Pollution Control Market, by Region, (USD Million) 2017-2036
Table 9 Germany Global India Outdoor Air Pollution Control Market, by Segment Analysis, (USD Million) 2017-2036
Table 10 U.K. Global India Outdoor Air Pollution Control Market, by Segment Analysis, (USD Million) 2017-2036
Table 11 France Global India Outdoor Air Pollution Control Market, by Segment Analysis, (USD Million) 2017-2036
Table 12 Italy Global India Outdoor Air Pollution Control Market, by Segment Analysis, (USD Million) 2017-2036
Table 13 Spain Global India Outdoor Air Pollution Control Market, by Segment Analysis, (USD Million) 2017-2036
Table 14 Sweden Global India Outdoor Air Pollution Control Market, by Segment Analysis, (USD Million) 2017-2036
Table 15 Denmark Global India Outdoor Air Pollution Control Market, by Segment Analysis, (USD Million) 2017-2036
Table 16 Norway Global India Outdoor Air Pollution Control Market, by Segment Analysis, (USD Million) 2017-2036
Table 17 The Netherlands Global India Outdoor Air Pollution Control Market, by Segment Analysis, (USD Million) 2017-2036
Table 18 Russia Global India Outdoor Air Pollution Control Market, by Segment Analysis, (USD Million) 2017-2036
Table 19 Asia Pacific Global India Outdoor Air Pollution Control Market, by Segment Analysis, (USD Million) 2017-2036
Table 20 Asia Pacific Global India Outdoor Air Pollution Control Market, by Region, (USD Million) 2017-2036
Table 21 China Global India Outdoor Air Pollution Control Market, by Segment Analysis, (USD Million) 2017-2036
Table 22 Japan Global India Outdoor Air Pollution Control Market, by Segment Analysis, (USD Million) 2017-2036
Table 23 India Global India Outdoor Air Pollution Control Market, by Segment Analysis, (USD Million) 2017-2036
Table 24 Australia Global India Outdoor Air Pollution Control Market, by Segment Analysis, (USD Million) 2017-2036
Table 25 South Korea Global India Outdoor Air Pollution Control Market, by Segment Analysis, (USD Million) 2017-2036
Table 26 Thailand Global India Outdoor Air Pollution Control Market, by Segment Analysis, (USD Million) 2017-2036
Table 27 Latin America Global India Outdoor Air Pollution Control Market, by Segment Analysis, (USD Million) 2017-2036
Table 28 Latin America Global India Outdoor Air Pollution Control Market, by Region, (USD Million) 2017-2036
Table 29 Brazil Global India Outdoor Air Pollution Control Market, by Segment Analysis, (USD Million) 2017-2036
Table 30 Mexico Global India Outdoor Air Pollution Control Market, by Segment Analysis, (USD Million) 2017-2036
Table 31 Argentina Global India Outdoor Air Pollution Control Market, by Segment Analysis, (USD Million) 2017-2036
Table 32 Middle East and Africa Global India Outdoor Air Pollution Control Market, by Segment Analysis, (USD Million) 2017-2036
Table 33 Middle East and Africa Global India Outdoor Air Pollution Control Market, by Region, (USD Million) 2017-2036
Table 34 South Africa Global India Outdoor Air Pollution Control Market, by Segment Analysis, (USD Million) 2017-2036
Table 35 Saudi Arabia Global India Outdoor Air Pollution Control Market, by Segment Analysis, (USD Million) 2017-2036
Table 36 UAE Global India Outdoor Air Pollution Control Market, by Segment Analysis, (USD Million) 2017-2036
Table 37 Kuwait Global India Outdoor Air Pollution Control Market, by Segment Analysis, (USD Million) 2017-2036
Table 38 Turkey Global India Outdoor Air Pollution Control Market, by Segment Analysis, (USD Million) 2017-2036
Fig.1 Market research process
Fig.2 Market research approaches
Fig.3 Global India Outdoor Air Pollution Control Market: market scenario
Fig.4 Global India Outdoor Air Pollution Control Market competitive outlook
Fig.5 Global India Outdoor Air Pollution Control Market driver analysis
Fig.6 Global India Outdoor Air Pollution Control Market restraint analysis
Fig.7 Global India Outdoor Air Pollution Control Market opportunity analysis
Fig.8 Global India Outdoor Air Pollution Control Market trends analysis
Fig.9 Global India Outdoor Air Pollution Control Market: Segment Analysis (Based on the scope)
Fig.10 Global India Outdoor Air Pollution Control Market: regional analysis
Fig.11 Global market shares and leading market players
Fig.12 North America market share and leading players
Fig.13 Europe market share and leading players
Fig.14 Asia Pacific market share and leading players
Fig.15 Latin America market share and leading players
Fig.16 Middle East & Africa market share and leading players
Fig.17 North America, by country
Fig.18 North America
Fig.19 North America market estimates and forecast, 2017-2036
Fig.20 U.S.
Fig.21 Canada
Fig.22 Europe
Fig.23 Europe market estimates and forecast, 2017-2036
Fig.24 U.K.
Fig.25 Germany
Fig.26 France
Fig.27 Italy
Fig.28 Spain
Fig.29 Sweden
Fig.30 Denmark
Fig.31 Norway
Fig.32 The Netherlands
Fig.33 Russia
Fig.34 Asia Pacific
Fig.35 Asia Pacific market estimates and forecast, 2017-2036
Fig.36 China
Fig.37 Japan
Fig.38 India
Fig.39 Australia
Fig.40 South Korea
Fig.41 Thailand
Fig.42 Latin America
Fig.43 Latin America market estimates and forecast, 2017-2036
Fig.44 Brazil
Fig.45 Mexico
Fig.46 Argentina
Fig.47 Colombia
Fig.48 Middle East and Africa
Fig.49 Middle East and Africa market estimates and forecast, 2017-2036
Fig.50 Saudi Arabia
Fig.51 South Africa
Fig.52 UAE
Fig.53 Kuwait
Fig.54 Turkey
The global Point-of-Use Water Treatment Systems Market is projected to grow from USD 36.51 billion in 2026 to USD 98.06 billion by 2036, driven by rising concerns over water quality, increasing health awareness, and growing demand for advanced household water purification solutions.
The Point-of-Use Water Treatment Systems Market is expected to register a CAGR of 9.89% during the forecast period from 2026 to 2036, supported by technological advancements, urbanization, and increasing adoption of decentralized water treatment systems.
Key growth drivers include rising concerns about water contamination, increasing prevalence of waterborne diseases, growing awareness of PFAS and heavy metal pollutants, expanding urban populations, aging municipal water infrastructure, and rising adoption of smart water purification technologies.
Reverse Osmosis (RO) systems currently account for a significant share of the market due to their ability to effectively remove dissolved solids, heavy metals, microorganisms, and chemical contaminants. Ultrafiltration, UV purification, and activated carbon filtration technologies are also witnessing strong adoption.
Asia-Pacific dominates the global market due to rapid urbanization, industrialization, growing water pollution concerns, rising disposable incomes, and increasing investments in residential and commercial water purification solutions across countries such as China, India, Japan, and South Korea.
Major market participants include A. O. Smith Corporation, Culligan International, Pentair plc, Kent RO Systems Ltd., Coway Co., Ltd., and LG Electronics.
Smart water purification systems equipped with IoT connectivity, real-time water quality monitoring, filter replacement alerts, predictive maintenance capabilities, and smartphone integration are enhancing user convenience, improving operational efficiency, and driving the adoption of advanced point-of-use water treatment solutions worldwide.
The global Point-of-Use (POU) Water Treatment Systems Market was valued at USD 36.51 billion in 2026 and is projected to reach USD 98.06 billion by 2036, registering a robust CAGR of 9.89% during the forecast period. The market is experiencing strong growth due to rising concerns regarding water contamination, increasing consumer awareness about health and hygiene, and growing demand for decentralized water purification solutions. Point-of-use systems provide immediate access to safe drinking water through advanced technologies such as reverse osmosis, ultrafiltration, activated carbon filtration, and ultraviolet disinfection, making them increasingly popular across residential, commercial, and institutional settings.
The market is further benefiting from rapid urbanization, aging water infrastructure, increasing prevalence of waterborne diseases, and rising environmental concerns associated with bottled water consumption. Technological advancements including smart monitoring systems, IoT-enabled filtration devices, and energy-efficient purification technologies are also enhancing consumer adoption. As governments and public health organizations continue to emphasize safe drinking water access, the demand for advanced point-of-use treatment systems is expected to accelerate significantly over the coming decade.
The market is benefiting from a combination of public health awareness, urbanization, and innovation in water treatment technologies. Consumers are increasingly seeking localized purification systems capable of removing contaminants while providing convenient access to clean drinking water. Advanced purification technologies such as multi-stage reverse osmosis systems, UV purification, ultrafiltration membranes, and activated carbon filters are becoming more widely adopted due to their effectiveness and reliability.
The integration of IoT-enabled monitoring systems, real-time water quality tracking, automated maintenance alerts, and smart-home compatibility is further transforming the competitive landscape. Manufacturers are introducing compact, energy-efficient, and user-friendly systems designed to meet the evolving preferences of modern consumers. As governments and public health organizations continue emphasizing safe drinking water access, demand for innovative POU treatment solutions is expected to strengthen globally.
North America represents a mature and technologically advanced market driven by increasing consumer awareness regarding contaminants such as PFAS, lead, and other emerging pollutants. Growing concerns surrounding aging water infrastructure and water quality reliability have encouraged widespread adoption of under-sink reverse osmosis systems, activated carbon filters, and smart purification technologies. Strong regulatory oversight and high consumer purchasing power continue to support market growth across the United States and Canada.
Europe maintains steady growth supported by stringent drinking water regulations, environmental sustainability initiatives, and growing consumer preference for eco-friendly alternatives to bottled water. Countries such as Germany, France, and the United Kingdom are witnessing increasing adoption of advanced filtration systems, particularly those designed to reduce plastic waste while maintaining high water quality standards. The region is also experiencing growing demand for digitally connected purification solutions capable of monitoring filtration performance and water quality in real time.
Asia-Pacific remains the largest and fastest-growing regional market due to rapid urbanization, industrialization, and rising concerns regarding water pollution. Countries including China, India, Japan, and several Southeast Asian nations continue to experience strong demand for residential and commercial water purification systems. Government initiatives focused on improving public health and water access are further supporting market expansion. Rising disposable incomes and increasing health consciousness among consumers are accelerating adoption of advanced filtration technologies throughout the region.
Latin America is witnessing gradual market growth as urban populations expand and concerns regarding waterborne diseases increase. Affordable filtration systems, including faucet-mounted and countertop solutions, are gaining popularity among consumers seeking cost-effective water treatment options. Meanwhile, the Middle East and Africa continue to experience growing demand due to water scarcity challenges, infrastructure limitations, and increasing awareness regarding safe drinking water solutions. Advanced reverse osmosis systems are particularly popular in Gulf countries, while cost-effective filtration technologies are widely adopted across developing markets.
The Point-of-Use Water Treatment Systems Market is highly competitive, with leading manufacturers competing through technological innovation, product performance, affordability, and brand reputation. Companies are focusing on developing advanced purification systems that combine multiple treatment technologies, including reverse osmosis, ultraviolet disinfection, activated carbon filtration, and ultrafiltration membranes, to enhance water quality and consumer confidence.
Smart water treatment solutions are becoming a major differentiator within the industry. Manufacturers are integrating digital monitoring systems, IoT-enabled sensors, predictive maintenance alerts, and smartphone connectivity to improve user experience and system efficiency. Product customization based on regional water quality conditions is also emerging as an important competitive strategy.
Additionally, sustainability considerations are influencing product development, with companies introducing energy-efficient systems, recyclable components, and solutions designed to reduce plastic bottle consumption. Strong after-sales service, filter replacement programs, certification compliance, and consumer trust remain critical factors influencing market leadership and long-term customer retention.
| Report Scope | Details |
| Report Version | 2026 |
| Growth Rate | CAGR of 9.89 % from 2026 to 2036 |
| Base Year | 2025 |
| Actual Estimates / Historical Data | 2017 - 2024 |
| Forecast Period | 2026 - 2036 |
| Quantitative Units | Revenue in USD million/billion & CAGR from 2026 to 2036 |
| Country Scope | North America (U.S., Canada), Europe (UK, Germany, France, Italy, Spain, Russia, Sweden, Denmark, Norway, Rest of Europe), Asia Pacific (Japan, China, India, Australia, South Korea, Thailand, Rest of Asia Pacific), Latin America (Brazil, Mexico, Argentina, Colombia, Rest of Latin America), Middle East & Africa (South Africa, Saudi Arabia, UAE, Kuwait, Rest of Middle East & Africa). |
| The Segment Covered by Technology |
|
| The Segment Covered by Device Type |
|
| Companies Covered |
|
| Report Coverage | Revenue forecast, company share, competitive landscape, growth factors, technology trends, and regional analysis |
| Free Customization Scope (Equivalent to 5 Analyst Working Days) | If you require additional insights beyond the current scope, our analysts can customize the report to meet your specific business needs. |
This report is developed using a comprehensive research framework designed to provide accurate, reliable, and actionable market intelligence. The analysis incorporates extensive primary research with industry stakeholders, manufacturers, distributors, technology providers, and water treatment specialists, combined with detailed secondary research from credible industry publications, government agencies, regulatory organizations, and company disclosures.
Each market estimate undergoes rigorous validation through data triangulation, trend analysis, and expert review processes to ensure consistency and accuracy. The report delivers objective insights into market dynamics, competitive developments, emerging technologies, and future growth opportunities, enabling stakeholders to make informed strategic decisions with confidence.
The research methodology combines both qualitative and quantitative approaches to provide a holistic assessment of the Point-of-Use Water Treatment Systems Market. Secondary research forms the foundation of the analysis and includes evaluation of industry reports, corporate filings, water quality studies, regulatory frameworks, trade publications, and market databases.
Primary research consists of interviews with senior executives, product managers, distributors, water treatment experts, and industry consultants. Insights gathered from these discussions are used to validate market assumptions, identify emerging trends, and assess future growth potential. Advanced forecasting models, market sizing techniques, regional demand analysis, and data triangulation methodologies are applied to generate accurate market projections and strategic insights.
This report has been prepared by a team of experienced market researchers, environmental technology analysts, and water treatment industry specialists with extensive expertise in global water infrastructure and purification technologies. The research team combines deep industry knowledge with advanced analytical methodologies to deliver reliable, objective, and actionable market intelligence.
Through continuous monitoring of regulatory developments, technological advancements, consumer preferences, and competitive activities, our analysts provide stakeholders with valuable insights into market evolution and future growth opportunities. This commitment to research excellence, transparency, and analytical rigor ensures that the report serves as a trusted resource for manufacturers, investors, distributors, policymakers, and water treatment solution providers worldwide.
Table 1 List of Abbreviation and acronyms
Table 2 List of Sources
Table 3 North America Global India Outdoor Air Pollution Control Market, by Segment Analysis, (USD Million) 2017-2036
Table 4 North America Global India Outdoor Air Pollution Control Market, by Region, (USD Million) 2017-2036
Table 5 U.S. Global India Outdoor Air Pollution Control Market, by Segment Analysis, (USD Million) 2017-2036
Table 6 Canada Global India Outdoor Air Pollution Control Market, by Segment Analysis, (USD Million) 2017-2036
Table 7 Europe Global India Outdoor Air Pollution Control Market, by Segment Analysis, (USD Million) 2017-2036
Table 8 Europe Global India Outdoor Air Pollution Control Market, by Region, (USD Million) 2017-2036
Table 9 Germany Global India Outdoor Air Pollution Control Market, by Segment Analysis, (USD Million) 2017-2036
Table 10 U.K. Global India Outdoor Air Pollution Control Market, by Segment Analysis, (USD Million) 2017-2036
Table 11 France Global India Outdoor Air Pollution Control Market, by Segment Analysis, (USD Million) 2017-2036
Table 12 Italy Global India Outdoor Air Pollution Control Market, by Segment Analysis, (USD Million) 2017-2036
Table 13 Spain Global India Outdoor Air Pollution Control Market, by Segment Analysis, (USD Million) 2017-2036
Table 14 Sweden Global India Outdoor Air Pollution Control Market, by Segment Analysis, (USD Million) 2017-2036
Table 15 Denmark Global India Outdoor Air Pollution Control Market, by Segment Analysis, (USD Million) 2017-2036
Table 16 Norway Global India Outdoor Air Pollution Control Market, by Segment Analysis, (USD Million) 2017-2036
Table 17 The Netherlands Global India Outdoor Air Pollution Control Market, by Segment Analysis, (USD Million) 2017-2036
Table 18 Russia Global India Outdoor Air Pollution Control Market, by Segment Analysis, (USD Million) 2017-2036
Table 19 Asia Pacific Global India Outdoor Air Pollution Control Market, by Segment Analysis, (USD Million) 2017-2036
Table 20 Asia Pacific Global India Outdoor Air Pollution Control Market, by Region, (USD Million) 2017-2036
Table 21 China Global India Outdoor Air Pollution Control Market, by Segment Analysis, (USD Million) 2017-2036
Table 22 Japan Global India Outdoor Air Pollution Control Market, by Segment Analysis, (USD Million) 2017-2036
Table 23 India Global India Outdoor Air Pollution Control Market, by Segment Analysis, (USD Million) 2017-2036
Table 24 Australia Global India Outdoor Air Pollution Control Market, by Segment Analysis, (USD Million) 2017-2036
Table 25 South Korea Global India Outdoor Air Pollution Control Market, by Segment Analysis, (USD Million) 2017-2036
Table 26 Thailand Global India Outdoor Air Pollution Control Market, by Segment Analysis, (USD Million) 2017-2036
Table 27 Latin America Global India Outdoor Air Pollution Control Market, by Segment Analysis, (USD Million) 2017-2036
Table 28 Latin America Global India Outdoor Air Pollution Control Market, by Region, (USD Million) 2017-2036
Table 29 Brazil Global India Outdoor Air Pollution Control Market, by Segment Analysis, (USD Million) 2017-2036
Table 30 Mexico Global India Outdoor Air Pollution Control Market, by Segment Analysis, (USD Million) 2017-2036
Table 31 Argentina Global India Outdoor Air Pollution Control Market, by Segment Analysis, (USD Million) 2017-2036
Table 32 Middle East and Africa Global India Outdoor Air Pollution Control Market, by Segment Analysis, (USD Million) 2017-2036
Table 33 Middle East and Africa Global India Outdoor Air Pollution Control Market, by Region, (USD Million) 2017-2036
Table 34 South Africa Global India Outdoor Air Pollution Control Market, by Segment Analysis, (USD Million) 2017-2036
Table 35 Saudi Arabia Global India Outdoor Air Pollution Control Market, by Segment Analysis, (USD Million) 2017-2036
Table 36 UAE Global India Outdoor Air Pollution Control Market, by Segment Analysis, (USD Million) 2017-2036
Table 37 Kuwait Global India Outdoor Air Pollution Control Market, by Segment Analysis, (USD Million) 2017-2036
Table 38 Turkey Global India Outdoor Air Pollution Control Market, by Segment Analysis, (USD Million) 2017-2036
Fig.1 Market research process
Fig.2 Market research approaches
Fig.3 Global India Outdoor Air Pollution Control Market: market scenario
Fig.4 Global India Outdoor Air Pollution Control Market competitive outlook
Fig.5 Global India Outdoor Air Pollution Control Market driver analysis
Fig.6 Global India Outdoor Air Pollution Control Market restraint analysis
Fig.7 Global India Outdoor Air Pollution Control Market opportunity analysis
Fig.8 Global India Outdoor Air Pollution Control Market trends analysis
Fig.9 Global India Outdoor Air Pollution Control Market: Segment Analysis (Based on the scope)
Fig.10 Global India Outdoor Air Pollution Control Market: regional analysis
Fig.11 Global market shares and leading market players
Fig.12 North America market share and leading players
Fig.13 Europe market share and leading players
Fig.14 Asia Pacific market share and leading players
Fig.15 Latin America market share and leading players
Fig.16 Middle East & Africa market share and leading players
Fig.17 North America, by country
Fig.18 North America
Fig.19 North America market estimates and forecast, 2017-2036
Fig.20 U.S.
Fig.21 Canada
Fig.22 Europe
Fig.23 Europe market estimates and forecast, 2017-2036
Fig.24 U.K.
Fig.25 Germany
Fig.26 France
Fig.27 Italy
Fig.28 Spain
Fig.29 Sweden
Fig.30 Denmark
Fig.31 Norway
Fig.32 The Netherlands
Fig.33 Russia
Fig.34 Asia Pacific
Fig.35 Asia Pacific market estimates and forecast, 2017-2036
Fig.36 China
Fig.37 Japan
Fig.38 India
Fig.39 Australia
Fig.40 South Korea
Fig.41 Thailand
Fig.42 Latin America
Fig.43 Latin America market estimates and forecast, 2017-2036
Fig.44 Brazil
Fig.45 Mexico
Fig.46 Argentina
Fig.47 Colombia
Fig.48 Middle East and Africa
Fig.49 Middle East and Africa market estimates and forecast, 2017-2036
Fig.50 Saudi Arabia
Fig.51 South Africa
Fig.52 UAE
Fig.53 Kuwait
Fig.54 Turkey

A license granted to one user. Rules or conditions might be applied for e.g. the use of electric files (PDFs) or printings, depending on product.
A license granted to multiple users.
A license granted to a single business site/establishment.
A license granted to all employees within organisation access to the product.
Immediate / Within 24-48 hours - Working days
Online Payments with PayPal and CCavenue
You can order a report by picking any of the payment methods which is bank wire or online payment through any Debit/Credit card or PayPal.
Hard Copy
Flame and Detonation Arrestors Market Overview The Global Flame and Detonation Arrestors Market was
Read MoreRising Air Pollution Levels Strengthening Market Demand Indias outdoor air pollution control market
Read More