The global Sports Nutrition Market valued at USD 28.50 billion in 2026, is projected to reach USD 89.47 billion by 2036, expanding at a CAGR of 11.81% during the forecast period. The market is witnessing strong momentum as sports nutrition products evolve from niche athletic supplements into mainstream health and wellness solutions. Rising awareness regarding fitness, muscle recovery, endurance enhancement, and overall wellness has expanded the consumer base beyond professional athletes to include fitness enthusiasts, recreational users, and health-conscious consumers.
Sports nutrition products are increasingly integrated into daily dietary routines, driven by growing demand for convenient, protein-rich, and performance-enhancing nutritional solutions. The increasing popularity of gym memberships, home-based fitness programs, organized sports participation, and active lifestyles continues to create substantial growth opportunities for manufacturers worldwide.
The sports nutrition market is expected to demonstrate sustained growth over the forecast period due to expanding health awareness and rising demand for functional nutrition products. Market revenues are anticipated to increase from USD 28.50 billion in 2026 to USD 89.47 billion by 2036. This growth trajectory reflects the increasing adoption of protein supplements, hydration products, recovery formulations, and performance enhancers across diverse consumer segments.
The market is also benefiting from the growing availability of sports nutrition products through online channels, specialty nutrition retailers, supermarkets, pharmacies, and direct-to-consumer platforms. Continuous product innovation and premiumization strategies are expected to further accelerate market expansion.

The sports nutrition industry is undergoing a significant transformation as consumers increasingly prioritize convenience, transparency, and product quality. Ready-to-drink protein beverages, high-protein snacks, and functional food products are gaining popularity among consumers seeking convenient nutrition solutions.
Digital retail channels continue to reshape purchasing behavior, allowing consumers to compare ingredients, nutritional profiles, pricing, and customer reviews before making purchase decisions. As a result, online sales have become one of the fastest-growing distribution channels in the industry.
Manufacturers are also focusing on clean-label formulations, plant-based proteins, sustainable sourcing, and clinically validated ingredients to meet evolving consumer expectations. Product innovation is increasingly centered on taste enhancement, convenience, and personalized nutrition solutions.
The sports nutrition market is experiencing structural growth driven by the transformation of protein supplementation into a mainstream dietary category. Consumers increasingly use sports nutrition products not only for athletic performance but also for meal replacement, satiety management, healthy snacking, and everyday wellness.
Protein supplements continue to dominate the market, accounting for approximately 46.0% of total product demand. Powder formulations hold around 52.0% of the form segment due to their affordability, versatility, and ease of customization. Athletes remain the largest end-user segment with approximately 44.0% share; however, rapid adoption among fitness enthusiasts and lifestyle consumers is significantly expanding the addressable market.
The growing influence of social media fitness culture, sports influencers, and digital health communities is further accelerating consumer awareness and product adoption globally.

North America currently holds the largest market share, supported by high fitness participation rates, strong sports culture, advanced retail infrastructure, and widespread awareness of nutritional supplementation. The region also benefits from the presence of major sports nutrition brands and strong e-commerce penetration.
European demand is supported by increasing health consciousness, growing sports participation, and rising demand for premium nutritional products across both professional and recreational users.
Asia-Pacific is expected to witness the fastest growth due to increasing disposable incomes, urbanization, expanding fitness infrastructure, and growing awareness of sports nutrition benefits.
Australia is projected to grow at a CAGR of 13.76% through 2036, supported by one of the highest per-capita consumption rates of sports nutrition products globally. Strong sports participation, fitness culture, and a mature supplement retail ecosystem continue to drive demand.
India is projected to grow at a CAGR of 9.76% through 2036, driven by expanding gym infrastructure, rising health awareness, increasing participation in fitness activities, and growing acceptance of protein supplementation among urban consumers.

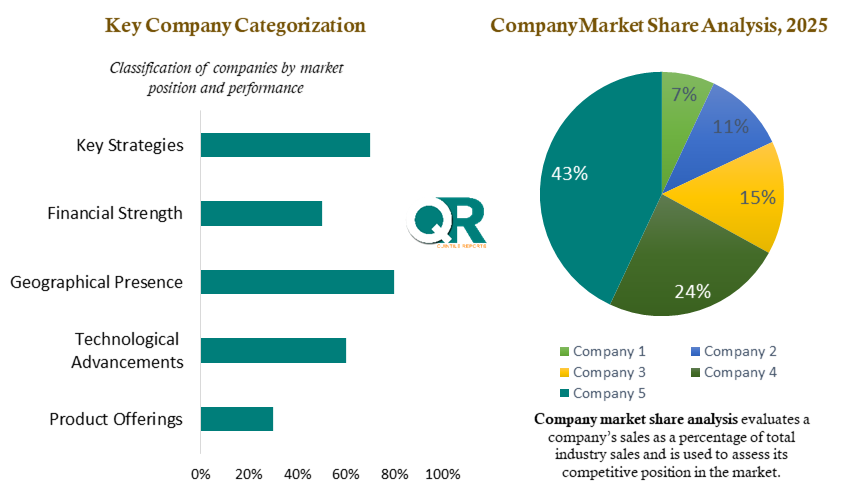
The competitive landscape is characterized by the presence of both specialized sports nutrition companies and multinational food and beverage corporations. Market participants are competing through product innovation, ingredient quality, scientific validation, flavor development, brand positioning, and omnichannel distribution strategies.
Leading companies are increasingly investing in research and development, influencer marketing, sports sponsorships, and direct-to-consumer platforms to strengthen brand visibility and customer engagement. The competitive advantage is gradually shifting from protein quantity alone toward factors such as taste, convenience, formulation quality, ingredient transparency, and lifestyle brand positioning.
Strategic partnerships with fitness centers, e-commerce platforms, athletes, and sports organizations are further supporting market penetration and brand differentiation. The market remains moderately consolidated, with leading brands focusing on product innovation, influencer partnerships, clinical validation, and omnichannel expansion strategies.
| Report Scope | Details |
| Report Version | 2026 |
| Growth Rate | CAGR of 11.81 % from 2026 to 2036 |
| Base Year | 2025 |
| Actual Estimates / Historical Data | 2017 - 2024 |
| Forecast Period | 2026 - 2036 |
| Quantitative Units | Revenue in USD million/billion & CAGR from 2026 to 2036 |
| Country Scope | North America (U.S., Canada), Europe (UK, Germany, France, Italy, Spain, Russia, Sweden, Denmark, Norway, Rest of Europe), Asia Pacific (Japan, China, India, Australia, South Korea, Thailand, Rest of Asia Pacific), Latin America (Brazil, Mexico, Argentina, Colombia, Rest of Latin America), Middle East & Africa (South Africa, Saudi Arabia, UAE, Kuwait, Rest of Middle East & Africa). |
| The Segment Covered by Product Type |
|
| The Segment Covered by Ingredient Type |
|
| Companies Covered |
|
| Report Coverage | Revenue forecast, company share, competitive landscape, growth factors, technology trends, and regional analysis |
| Free Customization Scope (Equivalent to 5 Analyst Working Days) | If you require additional insights beyond the current scope, our analysts can customize the report to meet your specific business needs. |
Industry analysts conducted interviews with sports nutrition manufacturers, brand managers, sports dietitians, fitness retailers, ingredient suppliers, and distribution channel stakeholders to validate market trends, pricing structures, and purchasing behavior.
Research findings were supported through analysis of industry publications, company reports, clinical nutrition studies, regulatory databases, sports participation statistics, and nutrition market datasets.
A combination of bottom-up and top-down approaches was employed to estimate market size and forecast future growth across product categories, forms, consumer groups, and regional markets.
Forecasts and market estimates were cross-verified using manufacturer disclosures, trade statistics, retail sales data, and industry benchmarks to ensure consistency and reliability.

This report has been prepared by industry analysts specializing in consumer health, nutrition, and functional food markets. The analysis combines extensive primary research, secondary intelligence, and market modeling techniques to provide actionable insights into industry developments, competitive dynamics, and future growth opportunities within the global sports nutrition market.
List of Tables
Table 1 List of Abbreviation and acronyms
Table 2 List of Sources
Table 3 North America Global Sports Nutrition Market, by Segment Analysis, (USD Million) 2017-2036
Table 4 North America Global Sports Nutrition Market, by Region, (USD Million) 2017-2036
Table 5 U.S. Global Sports Nutrition Market, by Segment Analysis, (USD Million) 2017-2036
Table 6 Canada Global Sports Nutrition Market, by Segment Analysis, (USD Million) 2017-2036
Table 7 Europe Global Sports Nutrition Market, by Segment Analysis, (USD Million) 2017-2036
Table 8 Europe Global Sports Nutrition Market, by Region, (USD Million) 2017-2036
Table 9 Germany Global Sports Nutrition Market, by Segment Analysis, (USD Million) 2017-2036
Table 10 U.K. Global Sports Nutrition Market, by Segment Analysis, (USD Million) 2017-2036
Table 11 France Global Sports Nutrition Market, by Segment Analysis, (USD Million) 2017-2036
Table 12 Italy Global Sports Nutrition Market, by Segment Analysis, (USD Million) 2017-2036
Table 13 Spain Global Sports Nutrition Market, by Segment Analysis, (USD Million) 2017-2036
Table 14 Sweden Global Sports Nutrition Market, by Segment Analysis, (USD Million) 2017-2036
Table 15 Denmark Global Sports Nutrition Market, by Segment Analysis, (USD Million) 2017-2036
Table 16 Norway Global Sports Nutrition Market, by Segment Analysis, (USD Million) 2017-2036
Table 17 The Netherlands Global Sports Nutrition Market, by Segment Analysis, (USD Million) 2017-2036
Table 18 Russia Global Sports Nutrition Market, by Segment Analysis, (USD Million) 2017-2036
Table 19 Asia Pacific Global Sports Nutrition Market, by Segment Analysis, (USD Million) 2017-2036
Table 20 Asia Pacific Global Sports Nutrition Market, by Region, (USD Million) 2017-2036
Table 21 China Global Sports Nutrition Market, by Segment Analysis, (USD Million) 2017-2036
Table 22 Japan Global Sports Nutrition Market, by Segment Analysis, (USD Million) 2017-2036
Table 23 India Global Sports Nutrition Market, by Segment Analysis, (USD Million) 2017-2036
Table 24 Australia Global Sports Nutrition Market, by Segment Analysis, (USD Million) 2017-2036
Table 25 South Korea Global Sports Nutrition Market, by Segment Analysis, (USD Million) 2017-2036
Table 26 Thailand Global Sports Nutrition Market, by Segment Analysis, (USD Million) 2017-2036
Table 27 Latin America Global Sports Nutrition Market, by Segment Analysis, (USD Million) 2017-2036
Table 28 Latin America Global Sports Nutrition Market, by Region, (USD Million) 2017-2036
Table 29 Brazil Global Sports Nutrition Market, by Segment Analysis, (USD Million) 2017-2036
Table 30 Mexico Global Sports Nutrition Market, by Segment Analysis, (USD Million) 2017-2036
Table 31 Argentina Global Sports Nutrition Market, by Segment Analysis, (USD Million) 2017-2036
Table 32 Middle East and Africa Global Sports Nutrition Market, by Segment Analysis, (USD Million) 2017-2036
Table 33 Middle East and Africa Global Sports Nutrition Market, by Region, (USD Million) 2017-2036
Table 34 South Africa Global Sports Nutrition Market, by Segment Analysis, (USD Million) 2017-2036
Table 35 Saudi Arabia Global Sports Nutrition Market, by Segment Analysis, (USD Million) 2017-2036
Table 36 UAE Global Sports Nutrition Market, by Segment Analysis, (USD Million) 2017-2036
Table 37 Kuwait Global Sports Nutrition Market, by Segment Analysis, (USD Million) 2017-2036
Table 38 Turkey Global Sports Nutrition Market, by Segment Analysis, (USD Million) 2017-2036
Fig.1 Market research process
Fig.2 Market research approaches
Fig.3 Global Sports Nutrition Market: market scenario
Fig.4 Global Sports Nutrition Market competitive outlook
Fig.5 Global Sports Nutrition Market driver analysis
Fig.6 Global Sports Nutrition Market restraint analysis
Fig.7 Global Sports Nutrition Market opportunity analysis
Fig.8 Global Sports Nutrition Market trends analysis
Fig.9 Global Sports Nutrition Market: Segment Analysis (Based on the scope)
Fig.10 Global Sports Nutrition Market: regional analysis
Fig.11 Global market shares and leading market players
Fig.12 North America market share and leading players
Fig.13 Europe market share and leading players
Fig.14 Asia Pacific market share and leading players
Fig.15 Latin America market share and leading players
Fig.16 Middle East & Africa market share and leading players
Fig.17 North America, by country
Fig.18 North America
Fig.19 North America market estimates and forecast, 2017-2036
Fig.20 U.S.
Fig.21 Canada
Fig.22 Europe
Fig.23 Europe market estimates and forecast, 2017-2036
Fig.24 U.K.
Fig.25 Germany
Fig.26 France
Fig.27 Italy
Fig.28 Spain
Fig.29 Sweden
Fig.30 Denmark
Fig.31 Norway
Fig.32 The Netherlands
Fig.33 Russia
Fig.34 Asia Pacific
Fig.35 Asia Pacific market estimates and forecast, 2017-2036
Fig.36 China
Fig.37 Japan
Fig.38 India
Fig.39 Australia
Fig.40 South Korea
Fig.41 Thailand
Fig.42 Latin America
Fig.43 Latin America market estimates and forecast, 2017-2036
Fig.44 Brazil
Fig.45 Mexico
Fig.46 Argentina
Fig.47 Colombia
Fig.48 Middle East and Africa
Fig.49 Middle East and Africa market estimates and forecast, 2017-2036
Fig.50 Saudi Arabia
Fig.51 South Africa
Fig.52 UAE
Fig.53 Kuwait
Fig.54 Turkey
The global Sports Nutrition Market is projected to grow from USD 28.50 billion in 2026 to approximately USD 89.47 billion by 2036, driven by increasing fitness participation, protein supplementation trends, and growing consumer focus on health and wellness.
The Sports Nutrition Market is expected to register a CAGR of 11.81% during the forecast period from 2026 to 2036.
Key growth drivers include rising fitness awareness, increasing gym memberships, mainstream adoption of protein supplementation, growing demand for functional nutrition products, and expanding e-commerce distribution channels.
Protein supplements, particularly protein powders and ready-to-drink (RTD) protein beverages, dominate the market due to their widespread use for muscle recovery, performance enhancement, healthy snacking, and weight management.
North America currently holds the largest market share, supported by strong fitness culture, high consumer awareness, advanced retail infrastructure, and the presence of major sports nutrition brands.
Major market participants include Abbott Laboratories, Glanbia plc, PepsiCo, The Coca-Cola Company, Nestlé, Herbalife, Amway Corporation, Muscletech, Dymatize, Quest Nutrition, and Cellucor.
Consumers are increasingly seeking plant-based proteins, natural ingredients, and clean-label formulations. This trend is encouraging manufacturers to launch vegan protein products, sustainable nutrition solutions, and minimally processed functional foods.
Major opportunities include growth in personalized nutrition, ready-to-drink protein beverages, functional snacks, plant-based supplements, emerging market expansion, and direct-to-consumer e-commerce channels.
The global Sports Nutrition Market valued at USD 28.50 billion in 2026, is projected to reach USD 89.47 billion by 2036, expanding at a CAGR of 11.81% during the forecast period. The market is witnessing strong momentum as sports nutrition products evolve from niche athletic supplements into mainstream health and wellness solutions. Rising awareness regarding fitness, muscle recovery, endurance enhancement, and overall wellness has expanded the consumer base beyond professional athletes to include fitness enthusiasts, recreational users, and health-conscious consumers.
Sports nutrition products are increasingly integrated into daily dietary routines, driven by growing demand for convenient, protein-rich, and performance-enhancing nutritional solutions. The increasing popularity of gym memberships, home-based fitness programs, organized sports participation, and active lifestyles continues to create substantial growth opportunities for manufacturers worldwide.
The sports nutrition market is expected to demonstrate sustained growth over the forecast period due to expanding health awareness and rising demand for functional nutrition products. Market revenues are anticipated to increase from USD 28.50 billion in 2026 to USD 89.47 billion by 2036. This growth trajectory reflects the increasing adoption of protein supplements, hydration products, recovery formulations, and performance enhancers across diverse consumer segments.
The market is also benefiting from the growing availability of sports nutrition products through online channels, specialty nutrition retailers, supermarkets, pharmacies, and direct-to-consumer platforms. Continuous product innovation and premiumization strategies are expected to further accelerate market expansion.
The sports nutrition industry is undergoing a significant transformation as consumers increasingly prioritize convenience, transparency, and product quality. Ready-to-drink protein beverages, high-protein snacks, and functional food products are gaining popularity among consumers seeking convenient nutrition solutions.
Digital retail channels continue to reshape purchasing behavior, allowing consumers to compare ingredients, nutritional profiles, pricing, and customer reviews before making purchase decisions. As a result, online sales have become one of the fastest-growing distribution channels in the industry.
Manufacturers are also focusing on clean-label formulations, plant-based proteins, sustainable sourcing, and clinically validated ingredients to meet evolving consumer expectations. Product innovation is increasingly centered on taste enhancement, convenience, and personalized nutrition solutions.
The sports nutrition market is experiencing structural growth driven by the transformation of protein supplementation into a mainstream dietary category. Consumers increasingly use sports nutrition products not only for athletic performance but also for meal replacement, satiety management, healthy snacking, and everyday wellness.
Protein supplements continue to dominate the market, accounting for approximately 46.0% of total product demand. Powder formulations hold around 52.0% of the form segment due to their affordability, versatility, and ease of customization. Athletes remain the largest end-user segment with approximately 44.0% share; however, rapid adoption among fitness enthusiasts and lifestyle consumers is significantly expanding the addressable market.
The growing influence of social media fitness culture, sports influencers, and digital health communities is further accelerating consumer awareness and product adoption globally.
North America currently holds the largest market share, supported by high fitness participation rates, strong sports culture, advanced retail infrastructure, and widespread awareness of nutritional supplementation. The region also benefits from the presence of major sports nutrition brands and strong e-commerce penetration.
European demand is supported by increasing health consciousness, growing sports participation, and rising demand for premium nutritional products across both professional and recreational users.
Asia-Pacific is expected to witness the fastest growth due to increasing disposable incomes, urbanization, expanding fitness infrastructure, and growing awareness of sports nutrition benefits.
Australia is projected to grow at a CAGR of 13.76% through 2036, supported by one of the highest per-capita consumption rates of sports nutrition products globally. Strong sports participation, fitness culture, and a mature supplement retail ecosystem continue to drive demand.
India is projected to grow at a CAGR of 9.76% through 2036, driven by expanding gym infrastructure, rising health awareness, increasing participation in fitness activities, and growing acceptance of protein supplementation among urban consumers.
The competitive landscape is characterized by the presence of both specialized sports nutrition companies and multinational food and beverage corporations. Market participants are competing through product innovation, ingredient quality, scientific validation, flavor development, brand positioning, and omnichannel distribution strategies.
Leading companies are increasingly investing in research and development, influencer marketing, sports sponsorships, and direct-to-consumer platforms to strengthen brand visibility and customer engagement. The competitive advantage is gradually shifting from protein quantity alone toward factors such as taste, convenience, formulation quality, ingredient transparency, and lifestyle brand positioning.
Strategic partnerships with fitness centers, e-commerce platforms, athletes, and sports organizations are further supporting market penetration and brand differentiation. The market remains moderately consolidated, with leading brands focusing on product innovation, influencer partnerships, clinical validation, and omnichannel expansion strategies.
| Report Scope | Details |
| Report Version | 2026 |
| Growth Rate | CAGR of 11.81 % from 2026 to 2036 |
| Base Year | 2025 |
| Actual Estimates / Historical Data | 2017 - 2024 |
| Forecast Period | 2026 - 2036 |
| Quantitative Units | Revenue in USD million/billion & CAGR from 2026 to 2036 |
| Country Scope | North America (U.S., Canada), Europe (UK, Germany, France, Italy, Spain, Russia, Sweden, Denmark, Norway, Rest of Europe), Asia Pacific (Japan, China, India, Australia, South Korea, Thailand, Rest of Asia Pacific), Latin America (Brazil, Mexico, Argentina, Colombia, Rest of Latin America), Middle East & Africa (South Africa, Saudi Arabia, UAE, Kuwait, Rest of Middle East & Africa). |
| The Segment Covered by Product Type |
|
| The Segment Covered by Ingredient Type |
|
| Companies Covered |
|
| Report Coverage | Revenue forecast, company share, competitive landscape, growth factors, technology trends, and regional analysis |
| Free Customization Scope (Equivalent to 5 Analyst Working Days) | If you require additional insights beyond the current scope, our analysts can customize the report to meet your specific business needs. |
Industry analysts conducted interviews with sports nutrition manufacturers, brand managers, sports dietitians, fitness retailers, ingredient suppliers, and distribution channel stakeholders to validate market trends, pricing structures, and purchasing behavior.
Research findings were supported through analysis of industry publications, company reports, clinical nutrition studies, regulatory databases, sports participation statistics, and nutrition market datasets.
A combination of bottom-up and top-down approaches was employed to estimate market size and forecast future growth across product categories, forms, consumer groups, and regional markets.
Forecasts and market estimates were cross-verified using manufacturer disclosures, trade statistics, retail sales data, and industry benchmarks to ensure consistency and reliability.
This report has been prepared by industry analysts specializing in consumer health, nutrition, and functional food markets. The analysis combines extensive primary research, secondary intelligence, and market modeling techniques to provide actionable insights into industry developments, competitive dynamics, and future growth opportunities within the global sports nutrition market.
Table 1 List of Abbreviation and acronyms
Table 2 List of Sources
Table 3 North America Global Sports Nutrition Market, by Segment Analysis, (USD Million) 2017-2036
Table 4 North America Global Sports Nutrition Market, by Region, (USD Million) 2017-2036
Table 5 U.S. Global Sports Nutrition Market, by Segment Analysis, (USD Million) 2017-2036
Table 6 Canada Global Sports Nutrition Market, by Segment Analysis, (USD Million) 2017-2036
Table 7 Europe Global Sports Nutrition Market, by Segment Analysis, (USD Million) 2017-2036
Table 8 Europe Global Sports Nutrition Market, by Region, (USD Million) 2017-2036
Table 9 Germany Global Sports Nutrition Market, by Segment Analysis, (USD Million) 2017-2036
Table 10 U.K. Global Sports Nutrition Market, by Segment Analysis, (USD Million) 2017-2036
Table 11 France Global Sports Nutrition Market, by Segment Analysis, (USD Million) 2017-2036
Table 12 Italy Global Sports Nutrition Market, by Segment Analysis, (USD Million) 2017-2036
Table 13 Spain Global Sports Nutrition Market, by Segment Analysis, (USD Million) 2017-2036
Table 14 Sweden Global Sports Nutrition Market, by Segment Analysis, (USD Million) 2017-2036
Table 15 Denmark Global Sports Nutrition Market, by Segment Analysis, (USD Million) 2017-2036
Table 16 Norway Global Sports Nutrition Market, by Segment Analysis, (USD Million) 2017-2036
Table 17 The Netherlands Global Sports Nutrition Market, by Segment Analysis, (USD Million) 2017-2036
Table 18 Russia Global Sports Nutrition Market, by Segment Analysis, (USD Million) 2017-2036
Table 19 Asia Pacific Global Sports Nutrition Market, by Segment Analysis, (USD Million) 2017-2036
Table 20 Asia Pacific Global Sports Nutrition Market, by Region, (USD Million) 2017-2036
Table 21 China Global Sports Nutrition Market, by Segment Analysis, (USD Million) 2017-2036
Table 22 Japan Global Sports Nutrition Market, by Segment Analysis, (USD Million) 2017-2036
Table 23 India Global Sports Nutrition Market, by Segment Analysis, (USD Million) 2017-2036
Table 24 Australia Global Sports Nutrition Market, by Segment Analysis, (USD Million) 2017-2036
Table 25 South Korea Global Sports Nutrition Market, by Segment Analysis, (USD Million) 2017-2036
Table 26 Thailand Global Sports Nutrition Market, by Segment Analysis, (USD Million) 2017-2036
Table 27 Latin America Global Sports Nutrition Market, by Segment Analysis, (USD Million) 2017-2036
Table 28 Latin America Global Sports Nutrition Market, by Region, (USD Million) 2017-2036
Table 29 Brazil Global Sports Nutrition Market, by Segment Analysis, (USD Million) 2017-2036
Table 30 Mexico Global Sports Nutrition Market, by Segment Analysis, (USD Million) 2017-2036
Table 31 Argentina Global Sports Nutrition Market, by Segment Analysis, (USD Million) 2017-2036
Table 32 Middle East and Africa Global Sports Nutrition Market, by Segment Analysis, (USD Million) 2017-2036
Table 33 Middle East and Africa Global Sports Nutrition Market, by Region, (USD Million) 2017-2036
Table 34 South Africa Global Sports Nutrition Market, by Segment Analysis, (USD Million) 2017-2036
Table 35 Saudi Arabia Global Sports Nutrition Market, by Segment Analysis, (USD Million) 2017-2036
Table 36 UAE Global Sports Nutrition Market, by Segment Analysis, (USD Million) 2017-2036
Table 37 Kuwait Global Sports Nutrition Market, by Segment Analysis, (USD Million) 2017-2036
Table 38 Turkey Global Sports Nutrition Market, by Segment Analysis, (USD Million) 2017-2036
Fig.1 Market research process
Fig.2 Market research approaches
Fig.3 Global Sports Nutrition Market: market scenario
Fig.4 Global Sports Nutrition Market competitive outlook
Fig.5 Global Sports Nutrition Market driver analysis
Fig.6 Global Sports Nutrition Market restraint analysis
Fig.7 Global Sports Nutrition Market opportunity analysis
Fig.8 Global Sports Nutrition Market trends analysis
Fig.9 Global Sports Nutrition Market: Segment Analysis (Based on the scope)
Fig.10 Global Sports Nutrition Market: regional analysis
Fig.11 Global market shares and leading market players
Fig.12 North America market share and leading players
Fig.13 Europe market share and leading players
Fig.14 Asia Pacific market share and leading players
Fig.15 Latin America market share and leading players
Fig.16 Middle East & Africa market share and leading players
Fig.17 North America, by country
Fig.18 North America
Fig.19 North America market estimates and forecast, 2017-2036
Fig.20 U.S.
Fig.21 Canada
Fig.22 Europe
Fig.23 Europe market estimates and forecast, 2017-2036
Fig.24 U.K.
Fig.25 Germany
Fig.26 France
Fig.27 Italy
Fig.28 Spain
Fig.29 Sweden
Fig.30 Denmark
Fig.31 Norway
Fig.32 The Netherlands
Fig.33 Russia
Fig.34 Asia Pacific
Fig.35 Asia Pacific market estimates and forecast, 2017-2036
Fig.36 China
Fig.37 Japan
Fig.38 India
Fig.39 Australia
Fig.40 South Korea
Fig.41 Thailand
Fig.42 Latin America
Fig.43 Latin America market estimates and forecast, 2017-2036
Fig.44 Brazil
Fig.45 Mexico
Fig.46 Argentina
Fig.47 Colombia
Fig.48 Middle East and Africa
Fig.49 Middle East and Africa market estimates and forecast, 2017-2036
Fig.50 Saudi Arabia
Fig.51 South Africa
Fig.52 UAE
Fig.53 Kuwait
Fig.54 Turkey

A license granted to one user. Rules or conditions might be applied for e.g. the use of electric files (PDFs) or printings, depending on product.
A license granted to multiple users.
A license granted to a single business site/establishment.
A license granted to all employees within organisation access to the product.
Immediate / Within 24-48 hours - Working days
Online Payments with PayPal and CCavenue
You can order a report by picking any of the payment methods which is bank wire or online payment through any Debit/Credit card or PayPal.
Hard Copy
Citrus Fiber Market Overview Citrus fiber is a plant-based, functional dietary ingredient recovered
Read MoreLiquid Mushroom Market Overview The global Liquid Mushroom Market was valued at USD 9.81 Billion in
Read MoreFresh Yeast Market Overview The global Fresh Yeast Market was valued at USD 4.10 Billion in 2026 and
Read More