The global Port Equipment Market was valued at USD 16.89 billion in 2026 and is projected to reach USD 29.95 billion by 2036, expanding at a CAGR of 5.89% during the forecast period. The market is experiencing sustained growth due to increasing global trade volumes, rapid expansion of containerized cargo transportation, and growing investments in smart port infrastructure worldwide.
Port equipment serves as the backbone of modern maritime logistics operations, enabling efficient cargo handling, vessel servicing, container management, and terminal operations. As ports evolve into digitally connected logistics ecosystems, operators are increasingly investing in advanced cranes, automated guided vehicles (AGVs), reach stackers, container handlers, and electrified cargo handling equipment to improve productivity, reduce turnaround times, and enhance operational sustainability.
The ongoing transformation toward automated and environmentally sustainable ports is expected to generate significant opportunities for equipment manufacturers and technology providers. Furthermore, increasing government investments in port modernization programs and maritime infrastructure development are likely to accelerate market growth over the next decade.
The port equipment market is undergoing a significant technological transformation driven by automation, digitization, and sustainability initiatives. Port operators are increasingly deploying intelligent cargo handling systems, remote-controlled cranes, automated stacking equipment, and IoT-enabled monitoring solutions to optimize terminal efficiency and improve operational visibility.
Growing international trade and the arrival of ultra-large container vessels are creating demand for higher-capacity equipment capable of managing increasing cargo volumes with minimal delays. Simultaneously, environmental regulations aimed at reducing emissions are encouraging the adoption of electric, hybrid, and alternative fuel-powered port machinery. These developments are driving substantial investments in next-generation equipment designed to improve throughput, lower operating costs, and support long-term sustainability objectives across global ports.


Asia-Pacific remains the largest and fastest-growing market for port equipment, supported by the region's dominant position in global trade and manufacturing. Countries such as China, India, Japan, South Korea, and Singapore continue to invest heavily in advanced port infrastructure, automated terminals, and smart logistics technologies. Major ports across the region are deploying automated cranes, electric cargo handling systems, and AI-powered operational platforms to accommodate growing cargo volumes and larger vessels.
North America is experiencing strong market growth due to significant investments in port modernization and terminal automation. Ports across the United States and Canada are upgrading equipment fleets to improve efficiency, enhance cybersecurity, and comply with environmental regulations. The growing adoption of electric rubber-tired gantry cranes and automated container handling systems reflects the region's commitment to sustainable operations.
Europe remains a mature but innovation-driven market characterized by extensive automation and decarbonization initiatives. Major ports such as Rotterdam, Hamburg, and Antwerp continue to invest in electrified equipment, digital terminal management systems, and smart logistics solutions. Strict environmental regulations and ambitious carbon reduction targets are accelerating the transition toward low-emission port operations throughout the region.
Latin America is steadily expanding its port infrastructure to support growing trade activities and improve cargo handling efficiency. Investments in terminal upgrades and replacement of aging equipment are creating opportunities for advanced port equipment suppliers. Meanwhile, the Middle East and Africa are witnessing increasing adoption of modern cargo handling technologies as governments seek to strengthen logistics networks, support economic diversification, and enhance maritime trade competitiveness.

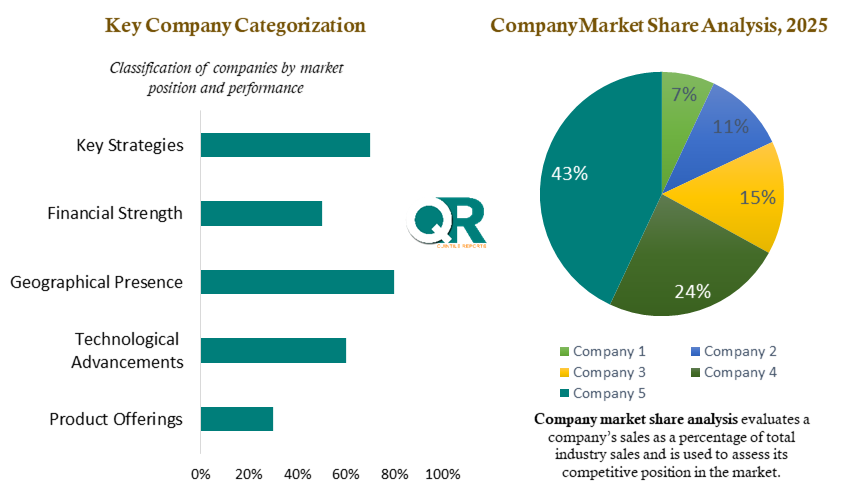
The port equipment market is moderately fragmented, with competition driven by technological innovation, operational efficiency, sustainability performance, and service capabilities. Leading manufacturers are investing heavily in automation technologies, electrification solutions, and intelligent cargo handling systems to strengthen their market positions.
Industry participants are focusing on developing automated cranes, electric-powered cargo handling equipment, predictive maintenance platforms, and integrated terminal management solutions. The ability to offer complete equipment portfolios alongside maintenance services, training programs, and digital support solutions has become an important competitive differentiator.
Strategic collaborations between equipment manufacturers, port authorities, logistics providers, and technology companies are further accelerating innovation across the industry. As ports continue to modernize, vendors capable of delivering customized, environmentally compliant, and technologically advanced solutions are expected to gain a significant competitive advantage.
| Report Scope | Details |
| Report Version | 2026 |
| Growth Rate | CAGR of 5.89 % from 2026 to 2036 |
| Base Year | 2025 |
| Actual Estimates / Historical Data | 2017 - 2024 |
| Forecast Period | 2026 - 2036 |
| Quantitative Units | Revenue in USD million/billion & CAGR from 2026 to 2036 |
| Country Scope | North America (U.S., Canada), Europe (UK, Germany, France, Italy, Spain, Russia, Sweden, Denmark, Norway, Rest of Europe), Asia Pacific (Japan, China, India, Australia, South Korea, Thailand, Rest of Asia Pacific), Latin America (Brazil, Mexico, Argentina, Colombia, Rest of Latin America), Middle East & Africa (South Africa, Saudi Arabia, UAE, Kuwait, Rest of Middle East & Africa). |
| The Segment Covered by Equipment Type |
|
| The Segment Covered by Operation |
|
| Companies Covered |
|
| Report Coverage | Revenue forecast, company share, competitive landscape, growth factors, technology trends, and regional analysis |
| Free Customization Scope (Equivalent to 5 Analyst Working Days) | If you require additional insights beyond the current scope, our analysts can customize the report to meet your specific business needs. |
This report is built upon a comprehensive research framework designed to provide accurate, objective, and actionable market intelligence. The study combines extensive primary research with in-depth secondary analysis to ensure that market estimates and forecasts reflect current industry realities and future growth opportunities.
Research findings are validated through consultations with port authorities, terminal operators, equipment manufacturers, logistics providers, maritime experts, and industry consultants. Data is further verified using multiple analytical models and triangulation techniques to ensure consistency and reliability.
By integrating quantitative market analysis with qualitative industry expertise, this report offers stakeholders a balanced and trustworthy assessment of market trends, technological developments, competitive dynamics, and investment opportunities.
The study utilizes a robust combination of primary and secondary research methodologies to evaluate the Port Equipment Market. Secondary research includes analysis of company reports, port authority publications, maritime trade statistics, government infrastructure plans, logistics databases, industry journals, and regulatory frameworks.
Primary research consists of interviews with senior executives from equipment manufacturing companies, port operators, logistics managers, technology providers, and industry experts. These interviews provide critical insights into market demand patterns, investment priorities, technological developments, and competitive strategies.
Advanced forecasting techniques, market modeling tools, demand-supply assessments, and regional trade analysis are employed to generate accurate market estimates. Data triangulation and expert validation processes further strengthen the reliability and credibility of the report's findings.

This report has been prepared by a team of experienced maritime industry analysts, logistics specialists, infrastructure researchers, and market intelligence professionals with extensive expertise in global transportation and port operations. The research team combines industry knowledge, technical understanding, and advanced analytical methodologies to deliver reliable, data-driven insights.
Our analysts continuously monitor maritime trade developments, infrastructure investments, regulatory changes, automation trends, and technological innovations to provide stakeholders with timely and actionable intelligence. Through a commitment to research excellence, transparency, and analytical rigor, this report serves as a trusted resource for manufacturers, port authorities, investors, logistics providers, and policymakers seeking to navigate the evolving port equipment market landscape with confidence.
List of Tables
Table 1 List of Abbreviation and acronyms
Table 2 List of Sources
Table 3 North America Global Port Equipment Market, by Segment Analysis, (USD Million) 2017-2036
Table 4 North America Global Port Equipment Market, by Region, (USD Million) 2017-2036
Table 5 U.S. Global Port Equipment Market, by Segment Analysis, (USD Million) 2017-2036
Table 6 Canada Global Port Equipment Market, by Segment Analysis, (USD Million) 2017-2036
Table 7 Europe Global Port Equipment Market, by Segment Analysis, (USD Million) 2017-2036
Table 8 Europe Global Port Equipment Market, by Region, (USD Million) 2017-2036
Table 9 Germany Global Port Equipment Market, by Segment Analysis, (USD Million) 2017-2036
Table 10 U.K. Global Port Equipment Market, by Segment Analysis, (USD Million) 2017-2036
Table 11 France Global Port Equipment Market, by Segment Analysis, (USD Million) 2017-2036
Table 12 Italy Global Port Equipment Market, by Segment Analysis, (USD Million) 2017-2036
Table 13 Spain Global Port Equipment Market, by Segment Analysis, (USD Million) 2017-2036
Table 14 Sweden Global Port Equipment Market, by Segment Analysis, (USD Million) 2017-2036
Table 15 Denmark Global Port Equipment Market, by Segment Analysis, (USD Million) 2017-2036
Table 16 Norway Global Port Equipment Market, by Segment Analysis, (USD Million) 2017-2036
Table 17 The Netherlands Global Port Equipment Market, by Segment Analysis, (USD Million) 2017-2036
Table 18 Russia Global Port Equipment Market, by Segment Analysis, (USD Million) 2017-2036
Table 19 Asia Pacific Global Port Equipment Market, by Segment Analysis, (USD Million) 2017-2036
Table 20 Asia Pacific Global Port Equipment Market, by Region, (USD Million) 2017-2036
Table 21 China Global Port Equipment Market, by Segment Analysis, (USD Million) 2017-2036
Table 22 Japan Global Port Equipment Market, by Segment Analysis, (USD Million) 2017-2036
Table 23 India Global Port Equipment Market, by Segment Analysis, (USD Million) 2017-2036
Table 24 Australia Global Port Equipment Market, by Segment Analysis, (USD Million) 2017-2036
Table 25 South Korea Global Port Equipment Market, by Segment Analysis, (USD Million) 2017-2036
Table 26 Thailand Global Port Equipment Market, by Segment Analysis, (USD Million) 2017-2036
Table 27 Latin America Global Port Equipment Market, by Segment Analysis, (USD Million) 2017-2036
Table 28 Latin America Global Port Equipment Market, by Region, (USD Million) 2017-2036
Table 29 Brazil Global Port Equipment Market, by Segment Analysis, (USD Million) 2017-2036
Table 30 Mexico Global Port Equipment Market, by Segment Analysis, (USD Million) 2017-2036
Table 31 Argentina Global Port Equipment Market, by Segment Analysis, (USD Million) 2017-2036
Table 32 Middle East and Africa Global Port Equipment Market, by Segment Analysis, (USD Million) 2017-2036
Table 33 Middle East and Africa Global Port Equipment Market, by Region, (USD Million) 2017-2036
Table 34 South Africa Global Port Equipment Market, by Segment Analysis, (USD Million) 2017-2036
Table 35 Saudi Arabia Global Port Equipment Market, by Segment Analysis, (USD Million) 2017-2036
Table 36 UAE Global Port Equipment Market, by Segment Analysis, (USD Million) 2017-2036
Table 37 Kuwait Global Port Equipment Market, by Segment Analysis, (USD Million) 2017-2036
Table 38 Turkey Global Port Equipment Market, by Segment Analysis, (USD Million) 2017-2036
Fig.1 Market research process
Fig.2 Market research approaches
Fig.3 Global Port Equipment Market: market scenario
Fig.4 Global Port Equipment Market competitive outlook
Fig.5 Global Port Equipment Market driver analysis
Fig.6 Global Port Equipment Market restraint analysis
Fig.7 Global Port Equipment Market opportunity analysis
Fig.8 Global Port Equipment Market trends analysis
Fig.9 Global Port Equipment Market: Segment Analysis (Based on the scope)
Fig.10 Global Port Equipment Market: regional analysis
Fig.11 Global market shares and leading market players
Fig.12 North America market share and leading players
Fig.13 Europe market share and leading players
Fig.14 Asia Pacific market share and leading players
Fig.15 Latin America market share and leading players
Fig.16 Middle East & Africa market share and leading players
Fig.17 North America, by country
Fig.18 North America
Fig.19 North America market estimates and forecast, 2017-2036
Fig.20 U.S.
Fig.21 Canada
Fig.22 Europe
Fig.23 Europe market estimates and forecast, 2017-2036
Fig.24 U.K.
Fig.25 Germany
Fig.26 France
Fig.27 Italy
Fig.28 Spain
Fig.29 Sweden
Fig.30 Denmark
Fig.31 Norway
Fig.32 The Netherlands
Fig.33 Russia
Fig.34 Asia Pacific
Fig.35 Asia Pacific market estimates and forecast, 2017-2036
Fig.36 China
Fig.37 Japan
Fig.38 India
Fig.39 Australia
Fig.40 South Korea
Fig.41 Thailand
Fig.42 Latin America
Fig.43 Latin America market estimates and forecast, 2017-2036
Fig.44 Brazil
Fig.45 Mexico
Fig.46 Argentina
Fig.47 Colombia
Fig.48 Middle East and Africa
Fig.49 Middle East and Africa market estimates and forecast, 2017-2036
Fig.50 Saudi Arabia
Fig.51 South Africa
Fig.52 UAE
Fig.53 Kuwait
Fig.54 Turkey
The global Port Equipment Market is projected to reach USD 29.95 billion by 2036, growing from USD 16.89 billion in 2026, driven by increasing global trade volumes, automation investments, and smart port development initiatives.
The Port Equipment Market is expected to grow at a CAGR of 5.89% during the forecast period from 2026 to 2036.
Growth is driven by rising containerized cargo volumes, increasing maritime trade activities, expansion of smart ports, growing adoption of automation technologies, and investments in sustainable port infrastructure.
Asia-Pacific dominates the market due to extensive maritime trade activity, major container ports, and significant investments in automated and smart port infrastructure across countries such as China, India, Japan, South Korea, and Singapore.
Major trends include automated guided vehicles (AGVs), remote-operated cranes, AI-powered terminal management systems, IoT-enabled monitoring platforms, predictive maintenance solutions, and electric or hybrid cargo handling equipment.
Automation improves cargo handling efficiency, reduces vessel turnaround times, enhances operational safety, lowers labor dependency, and increases throughput across container terminals and logistics facilities.
Key market participants include Konecranes, Kalmar (Cargotec), Liebherr Group, ZPMC, SANY Group, and Toyota Material Handling.
The global Port Equipment Market was valued at USD 16.89 billion in 2026 and is projected to reach USD 29.95 billion by 2036, expanding at a CAGR of 5.89% during the forecast period. The market is experiencing sustained growth due to increasing global trade volumes, rapid expansion of containerized cargo transportation, and growing investments in smart port infrastructure worldwide.
Port equipment serves as the backbone of modern maritime logistics operations, enabling efficient cargo handling, vessel servicing, container management, and terminal operations. As ports evolve into digitally connected logistics ecosystems, operators are increasingly investing in advanced cranes, automated guided vehicles (AGVs), reach stackers, container handlers, and electrified cargo handling equipment to improve productivity, reduce turnaround times, and enhance operational sustainability.
The ongoing transformation toward automated and environmentally sustainable ports is expected to generate significant opportunities for equipment manufacturers and technology providers. Furthermore, increasing government investments in port modernization programs and maritime infrastructure development are likely to accelerate market growth over the next decade.
The port equipment market is undergoing a significant technological transformation driven by automation, digitization, and sustainability initiatives. Port operators are increasingly deploying intelligent cargo handling systems, remote-controlled cranes, automated stacking equipment, and IoT-enabled monitoring solutions to optimize terminal efficiency and improve operational visibility.
Growing international trade and the arrival of ultra-large container vessels are creating demand for higher-capacity equipment capable of managing increasing cargo volumes with minimal delays. Simultaneously, environmental regulations aimed at reducing emissions are encouraging the adoption of electric, hybrid, and alternative fuel-powered port machinery. These developments are driving substantial investments in next-generation equipment designed to improve throughput, lower operating costs, and support long-term sustainability objectives across global ports.
Asia-Pacific remains the largest and fastest-growing market for port equipment, supported by the region's dominant position in global trade and manufacturing. Countries such as China, India, Japan, South Korea, and Singapore continue to invest heavily in advanced port infrastructure, automated terminals, and smart logistics technologies. Major ports across the region are deploying automated cranes, electric cargo handling systems, and AI-powered operational platforms to accommodate growing cargo volumes and larger vessels.
North America is experiencing strong market growth due to significant investments in port modernization and terminal automation. Ports across the United States and Canada are upgrading equipment fleets to improve efficiency, enhance cybersecurity, and comply with environmental regulations. The growing adoption of electric rubber-tired gantry cranes and automated container handling systems reflects the region's commitment to sustainable operations.
Europe remains a mature but innovation-driven market characterized by extensive automation and decarbonization initiatives. Major ports such as Rotterdam, Hamburg, and Antwerp continue to invest in electrified equipment, digital terminal management systems, and smart logistics solutions. Strict environmental regulations and ambitious carbon reduction targets are accelerating the transition toward low-emission port operations throughout the region.
Latin America is steadily expanding its port infrastructure to support growing trade activities and improve cargo handling efficiency. Investments in terminal upgrades and replacement of aging equipment are creating opportunities for advanced port equipment suppliers. Meanwhile, the Middle East and Africa are witnessing increasing adoption of modern cargo handling technologies as governments seek to strengthen logistics networks, support economic diversification, and enhance maritime trade competitiveness.
The port equipment market is moderately fragmented, with competition driven by technological innovation, operational efficiency, sustainability performance, and service capabilities. Leading manufacturers are investing heavily in automation technologies, electrification solutions, and intelligent cargo handling systems to strengthen their market positions.
Industry participants are focusing on developing automated cranes, electric-powered cargo handling equipment, predictive maintenance platforms, and integrated terminal management solutions. The ability to offer complete equipment portfolios alongside maintenance services, training programs, and digital support solutions has become an important competitive differentiator.
Strategic collaborations between equipment manufacturers, port authorities, logistics providers, and technology companies are further accelerating innovation across the industry. As ports continue to modernize, vendors capable of delivering customized, environmentally compliant, and technologically advanced solutions are expected to gain a significant competitive advantage.
| Report Scope | Details |
| Report Version | 2026 |
| Growth Rate | CAGR of 5.89 % from 2026 to 2036 |
| Base Year | 2025 |
| Actual Estimates / Historical Data | 2017 - 2024 |
| Forecast Period | 2026 - 2036 |
| Quantitative Units | Revenue in USD million/billion & CAGR from 2026 to 2036 |
| Country Scope | North America (U.S., Canada), Europe (UK, Germany, France, Italy, Spain, Russia, Sweden, Denmark, Norway, Rest of Europe), Asia Pacific (Japan, China, India, Australia, South Korea, Thailand, Rest of Asia Pacific), Latin America (Brazil, Mexico, Argentina, Colombia, Rest of Latin America), Middle East & Africa (South Africa, Saudi Arabia, UAE, Kuwait, Rest of Middle East & Africa). |
| The Segment Covered by Equipment Type |
|
| The Segment Covered by Operation |
|
| Companies Covered |
|
| Report Coverage | Revenue forecast, company share, competitive landscape, growth factors, technology trends, and regional analysis |
| Free Customization Scope (Equivalent to 5 Analyst Working Days) | If you require additional insights beyond the current scope, our analysts can customize the report to meet your specific business needs. |
This report is built upon a comprehensive research framework designed to provide accurate, objective, and actionable market intelligence. The study combines extensive primary research with in-depth secondary analysis to ensure that market estimates and forecasts reflect current industry realities and future growth opportunities.
Research findings are validated through consultations with port authorities, terminal operators, equipment manufacturers, logistics providers, maritime experts, and industry consultants. Data is further verified using multiple analytical models and triangulation techniques to ensure consistency and reliability.
By integrating quantitative market analysis with qualitative industry expertise, this report offers stakeholders a balanced and trustworthy assessment of market trends, technological developments, competitive dynamics, and investment opportunities.
The study utilizes a robust combination of primary and secondary research methodologies to evaluate the Port Equipment Market. Secondary research includes analysis of company reports, port authority publications, maritime trade statistics, government infrastructure plans, logistics databases, industry journals, and regulatory frameworks.
Primary research consists of interviews with senior executives from equipment manufacturing companies, port operators, logistics managers, technology providers, and industry experts. These interviews provide critical insights into market demand patterns, investment priorities, technological developments, and competitive strategies.
Advanced forecasting techniques, market modeling tools, demand-supply assessments, and regional trade analysis are employed to generate accurate market estimates. Data triangulation and expert validation processes further strengthen the reliability and credibility of the report's findings.
This report has been prepared by a team of experienced maritime industry analysts, logistics specialists, infrastructure researchers, and market intelligence professionals with extensive expertise in global transportation and port operations. The research team combines industry knowledge, technical understanding, and advanced analytical methodologies to deliver reliable, data-driven insights.
Our analysts continuously monitor maritime trade developments, infrastructure investments, regulatory changes, automation trends, and technological innovations to provide stakeholders with timely and actionable intelligence. Through a commitment to research excellence, transparency, and analytical rigor, this report serves as a trusted resource for manufacturers, port authorities, investors, logistics providers, and policymakers seeking to navigate the evolving port equipment market landscape with confidence.
Table 1 List of Abbreviation and acronyms
Table 2 List of Sources
Table 3 North America Global Port Equipment Market, by Segment Analysis, (USD Million) 2017-2036
Table 4 North America Global Port Equipment Market, by Region, (USD Million) 2017-2036
Table 5 U.S. Global Port Equipment Market, by Segment Analysis, (USD Million) 2017-2036
Table 6 Canada Global Port Equipment Market, by Segment Analysis, (USD Million) 2017-2036
Table 7 Europe Global Port Equipment Market, by Segment Analysis, (USD Million) 2017-2036
Table 8 Europe Global Port Equipment Market, by Region, (USD Million) 2017-2036
Table 9 Germany Global Port Equipment Market, by Segment Analysis, (USD Million) 2017-2036
Table 10 U.K. Global Port Equipment Market, by Segment Analysis, (USD Million) 2017-2036
Table 11 France Global Port Equipment Market, by Segment Analysis, (USD Million) 2017-2036
Table 12 Italy Global Port Equipment Market, by Segment Analysis, (USD Million) 2017-2036
Table 13 Spain Global Port Equipment Market, by Segment Analysis, (USD Million) 2017-2036
Table 14 Sweden Global Port Equipment Market, by Segment Analysis, (USD Million) 2017-2036
Table 15 Denmark Global Port Equipment Market, by Segment Analysis, (USD Million) 2017-2036
Table 16 Norway Global Port Equipment Market, by Segment Analysis, (USD Million) 2017-2036
Table 17 The Netherlands Global Port Equipment Market, by Segment Analysis, (USD Million) 2017-2036
Table 18 Russia Global Port Equipment Market, by Segment Analysis, (USD Million) 2017-2036
Table 19 Asia Pacific Global Port Equipment Market, by Segment Analysis, (USD Million) 2017-2036
Table 20 Asia Pacific Global Port Equipment Market, by Region, (USD Million) 2017-2036
Table 21 China Global Port Equipment Market, by Segment Analysis, (USD Million) 2017-2036
Table 22 Japan Global Port Equipment Market, by Segment Analysis, (USD Million) 2017-2036
Table 23 India Global Port Equipment Market, by Segment Analysis, (USD Million) 2017-2036
Table 24 Australia Global Port Equipment Market, by Segment Analysis, (USD Million) 2017-2036
Table 25 South Korea Global Port Equipment Market, by Segment Analysis, (USD Million) 2017-2036
Table 26 Thailand Global Port Equipment Market, by Segment Analysis, (USD Million) 2017-2036
Table 27 Latin America Global Port Equipment Market, by Segment Analysis, (USD Million) 2017-2036
Table 28 Latin America Global Port Equipment Market, by Region, (USD Million) 2017-2036
Table 29 Brazil Global Port Equipment Market, by Segment Analysis, (USD Million) 2017-2036
Table 30 Mexico Global Port Equipment Market, by Segment Analysis, (USD Million) 2017-2036
Table 31 Argentina Global Port Equipment Market, by Segment Analysis, (USD Million) 2017-2036
Table 32 Middle East and Africa Global Port Equipment Market, by Segment Analysis, (USD Million) 2017-2036
Table 33 Middle East and Africa Global Port Equipment Market, by Region, (USD Million) 2017-2036
Table 34 South Africa Global Port Equipment Market, by Segment Analysis, (USD Million) 2017-2036
Table 35 Saudi Arabia Global Port Equipment Market, by Segment Analysis, (USD Million) 2017-2036
Table 36 UAE Global Port Equipment Market, by Segment Analysis, (USD Million) 2017-2036
Table 37 Kuwait Global Port Equipment Market, by Segment Analysis, (USD Million) 2017-2036
Table 38 Turkey Global Port Equipment Market, by Segment Analysis, (USD Million) 2017-2036
Fig.1 Market research process
Fig.2 Market research approaches
Fig.3 Global Port Equipment Market: market scenario
Fig.4 Global Port Equipment Market competitive outlook
Fig.5 Global Port Equipment Market driver analysis
Fig.6 Global Port Equipment Market restraint analysis
Fig.7 Global Port Equipment Market opportunity analysis
Fig.8 Global Port Equipment Market trends analysis
Fig.9 Global Port Equipment Market: Segment Analysis (Based on the scope)
Fig.10 Global Port Equipment Market: regional analysis
Fig.11 Global market shares and leading market players
Fig.12 North America market share and leading players
Fig.13 Europe market share and leading players
Fig.14 Asia Pacific market share and leading players
Fig.15 Latin America market share and leading players
Fig.16 Middle East & Africa market share and leading players
Fig.17 North America, by country
Fig.18 North America
Fig.19 North America market estimates and forecast, 2017-2036
Fig.20 U.S.
Fig.21 Canada
Fig.22 Europe
Fig.23 Europe market estimates and forecast, 2017-2036
Fig.24 U.K.
Fig.25 Germany
Fig.26 France
Fig.27 Italy
Fig.28 Spain
Fig.29 Sweden
Fig.30 Denmark
Fig.31 Norway
Fig.32 The Netherlands
Fig.33 Russia
Fig.34 Asia Pacific
Fig.35 Asia Pacific market estimates and forecast, 2017-2036
Fig.36 China
Fig.37 Japan
Fig.38 India
Fig.39 Australia
Fig.40 South Korea
Fig.41 Thailand
Fig.42 Latin America
Fig.43 Latin America market estimates and forecast, 2017-2036
Fig.44 Brazil
Fig.45 Mexico
Fig.46 Argentina
Fig.47 Colombia
Fig.48 Middle East and Africa
Fig.49 Middle East and Africa market estimates and forecast, 2017-2036
Fig.50 Saudi Arabia
Fig.51 South Africa
Fig.52 UAE
Fig.53 Kuwait
Fig.54 Turkey

A license granted to one user. Rules or conditions might be applied for e.g. the use of electric files (PDFs) or printings, depending on product.
A license granted to multiple users.
A license granted to a single business site/establishment.
A license granted to all employees within organisation access to the product.
Immediate / Within 24-48 hours - Working days
Online Payments with PayPal and CCavenue
You can order a report by picking any of the payment methods which is bank wire or online payment through any Debit/Credit card or PayPal.
Hard Copy