Walk into any supermarket today and the spreads aisle tells a surprisingly complex story. What once sat quietly next to butter as the "cheaper option" has quietly evolved into a category that the numbers now validate: the global margarine market is valued at USD 2.37 billion in 2026 and is projected to reach USD 3.30 billion by 2036, growing at a steady CAGR of 3.36% over the decade ahead.
That's not explosive growth and that's actually the point. This isn't a hype-driven category riding a single trend. It's a market expanding on durable, structural foundations: the global rise of industrial food manufacturing, a genuine plant-based repositioning, and health-driven reformulation that has fundamentally changed what margarine actually is.
The product itself has changed more than most consumers realize. Modern margarine formulations bear little resemblance to the hydrogenated, trans-fat-laden spreads that drew regulatory fire and consumer backlash through the 1990s and early 2000s. Today's versions are typically built on refined vegetable oils soybean, rapeseed, sunflower, and palm combined with water, emulsifiers, and often added vitamins A and D. Most commercially significant products are now trans-fat-free, and many are actively marketed on their unsaturated fat profiles.
This reformulation push wasn't cosmetic. Regulatory pressure in the EU, US, and other markets essentially forced manufacturers to either clean up their recipes or exit the category. Those that stayed invested heavily in emulsification technology, fat blend optimization, and texture engineering resulting in products that hold up in industrial baking, spread cleanly from the fridge, and deliver consistent results across pastry and confectionery applications.
The USD 2.37 billion figure reflects a market that has already survived its most existential challenge the trans-fat regulatory crisis and rebuilt on stronger ground. The path to USD 3.30 billion by 2036 runs through Asia-Pacific's expanding bakery sector, Europe's clean-label reformulation wave, and a plant-based consumer shift that has given this decades-old category an unexpected second chapter.

In commercial food manufacturing bakeries, snack producers, ready-meal kitchens margarine competes directly with butter on functional terms while offering a significant cost advantage. When commodity butter prices spike (as they have repeatedly in recent years), large-scale food producers don't switch back easily. Margarine's shelf stability and performance consistency give procurement teams reasons beyond just cost to stay loyal.
A product that was historically positioned as an industrial commodity is now being repositioned successfully in many markets as a dairy-free, vegan-friendly spread. This is particularly visible in Germany, where the vegan movement has real cultural traction, and in the UK, where plant-based claims are increasingly a mainstream retail expectation rather than a niche differentiator.
While consumer retail gets most of the marketing attention, a significant portion of margarine consumption happens invisibly inside cakes, biscuits, croissants, and packaged pastries. The expanding processed and convenience food industry across Asia-Pacific and Latin America is pulling margarine consumption along with it, even in markets where most consumers have never bought a tub for home use.
Margarine fortified with omega-3 fatty acids, plant sterols, or vitamins is a genuine product innovation, not just a label refresh. These variants allow manufacturers to move upmarket, command better margins, and reframe margarine as a proactive health choice rather than a concession.
Despite significant reformulation, a meaningful share of consumers particularly in urban premium markets associate margarine with artificiality. When shoppers are choosing between a product that lists twelve ingredients and one that lists two, the emulsifier-rich margarine often loses, regardless of its actual nutritional profile. This perception gap is a structural challenge, not just a marketing problem.
Palm oil and soybean oil the backbone of most margarine formulations are globally traded commodities subject to weather events, policy shifts, and geopolitical disruptions. A drought in Southeast Asia or an Indonesian export restriction can move input costs sharply in a matter of weeks. Manufacturers with integrated supply chains or long-term procurement contracts are significantly better positioned than those buying on spot markets.
A product formulation approved in one jurisdiction may require reformulation, relabeling, or re-documentation to enter another. For companies running global or multi-regional portfolios, compliance isn't a one-time cost it's an ongoing operational burden that particularly hits mid-sized players who lack dedicated regulatory teams.

North America is fundamentally a health-repositioning story. The core consumer case is shifting from "cheaper than butter" to "better for your cholesterol than butter," with fortified and trans-fat-free variants doing most of the heavy lifting. Vegan and lactose-intolerant consumers are also a growing addressable segment.
Europe is mature but not static. High per capita consumption in the Netherlands, Germany, and Scandinavia reflects deeply embedded bread-eating traditions. The more interesting dynamic here is the sustainability angle consumers and retailers alike are applying pressure on palm oil sourcing, pushing manufacturers toward RSPO-certified supply chains and alternative oil blends. Clean-label reformulation is ongoing across the region's major brands.
Asia-Pacific is the genuine growth engine of the global margarine market. Rising incomes, rapidly expanding bakery and convenience food sectors, and Western dietary influence are all pulling in the same direction. China, India, and Indonesia are the headline markets, but the underlying driver urbanization paired with expanding modern retail is a structural trend that still has years to run.
Latin America shows steady, if unspectacular, growth. Brazil and Mexico lead, driven by home baking culture, affordability, and gradual health awareness. The opportunity here is less about premium repositioning and more about market penetration and building long-term brand loyalty.
Middle East and Africa are early-stage markets with genuine long-run potential. Population growth, urbanization, and rising cardiovascular health awareness are the structural tailwinds. Fortified and trans-fat-free margarine products are gaining meaningful traction in urban centers across the Gulf and southern Africa.
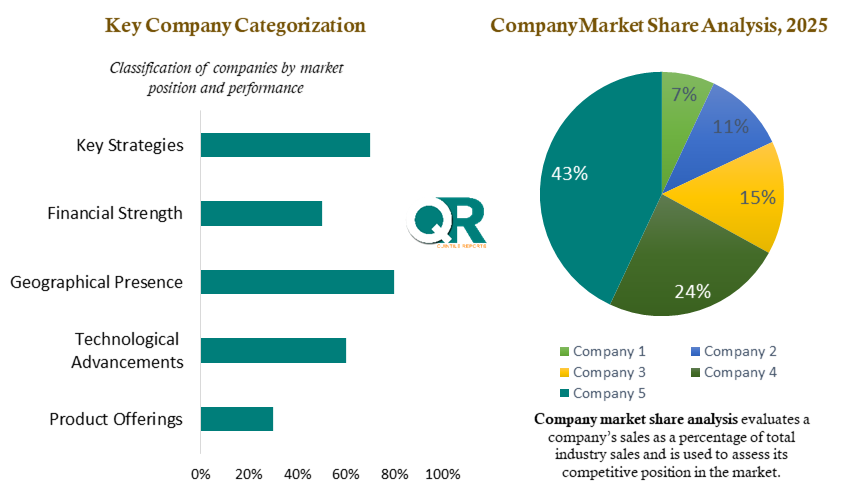
The global margarine industry is shaped by a handful of large, vertically integrated players but how they compete varies sharply by segment:
In premium consumer retail, the game is brand equity, clean ingredient labels, and sustainability credentials. Upfield's 2024 launch of a fully recyclable, plastic-free paper tub for its Flora and Blue Band ranges is a clear illustration a packaging decision that signals a company-wide sustainability commitment rather than a simple product update.
In industrial and foodservice supply, the differentiators are reliability, technical fat performance, and procurement scale. Custom blends engineered for specific baking conditions, shelf-life targets, and processing temperatures matter far more than brand story.
In emerging markets, distribution depth and price accessibility are often the decisive factors. Reaching the right wholesale and modern trade channels with locally adapted formulations consistently outperforms brand-led strategies in price-sensitive geographies.
Margarine is a market that has survived a near-death experience the trans-fat regulatory crisis and emerged with a more defensible position than many observers expected. Growing from USD 2.37 billion in 2026 to USD 3.30 billion by 2036, its trajectory rests on four converging forces:
The companies that will define this category through 2036 are those that can maintain the supply chain efficiency and cost discipline that makes the industrial economics work while simultaneously building the clean-label, sustainability, and functional health credentials that modern consumers and retail buyers increasingly demand. That's a difficult balance. But the market's top performers are already navigating it and the gap between those who do it well and those who don't is only going to widen.

This section analyzes how leading companies differentiate through organic certification, cold-press and enzymatic extraction technologies, clean-label product positioning, non-GMO and allergen-free claims, flavor innovation, and value segments, helping stakeholders evaluate innovation, operational efficiency, and competitive market positioning.
The company profiles include business overview, product and service portfolios, financial performance, and geographic presence. The analysis also highlights recent developments such as partnerships, mergers, product launches, digital integration strategies, and regional expansion initiatives, helping stakeholders understand competitive intensity and benchmark leading industry participants.
| Report Scope | Details |
| Report Version | 2026 |
| Growth Rate | CAGR of 3.36% from 2026 to 2036 |
| Base Year | 2025 |
| Actual Estimates / Historical Data | 2017 - 2024 |
| Forecast Period | 2026 - 2036 |
| Quantitative Units | Revenue in USD million/billion & CAGR from 2026 to 2036 |
| Country Scope | North America (U.S., Canada), Europe (UK, Germany, France, Italy, Spain, Russia, Sweden, Denmark, Norway, Rest of Europe), Asia Pacific (Japan, China, India, Australia, South Korea, Thailand, Rest of Asia Pacific), Latin America (Brazil, Mexico, Argentina, Colombia, Rest of Latin America), Middle East & Africa (South Africa, Saudi Arabia, UAE, Kuwait, Rest of Middle East & Africa). |
| The Segment Covered by Product Type & Form |
|
| The Segment Covered by Source & Ingredient Base |
|
| Companies Covered |
|
| Report Coverage | Revenue forecast, company share, competitive landscape, growth factors, technology trends, and regional analysis |
| Free Customization Scope (Equivalent to 5 Analyst Working Days) | If you require additional insights beyond the current scope, our analysts can customize the report to meet your specific business needs. |
This margarine market report is built on a combination of primary and secondary research methodologies designed to ensure accuracy, depth, and real-world relevance:

The Margarine market report provides detailed insights into market size, share, and growth trends from 2026 to 2036, along with a comprehensive forecast outlook. The study combines historical analysis (2017 - 2024) with future projections to deliver a complete market perspective for stakeholders, investors, manufacturers, and strategic decision-makers. To request a sample PDF or obtain further information, contact our analyst team at sales@quintilereports.com.
Author: Anaya Shetty, Senior Market Analyst Food & Nutrition Industry
Last Updated: April 2026
Anaya Shetty has over 12 years of experience in food ingredient and consumer packaged goods market research, specializing in edible oils, margarine and spreads, bakery ingredients, plant-based dairy alternatives, and functional fat formulations. She leads the Food & Nutrition research division at Quintile Reports, overseeing analysis across commercial bakery inputs, table spreads, foodservice supply chains, and health-oriented fat innovation. The analysis draws on primary interviews conducted with margarine manufacturers, vegetable oil processors, commercial bakery procurement teams, foodservice distributors, and retail category managers across North America, Europe, and Asia-Pacific during Q1 2026.
Reviewed By: Anaya Shetty, Senior Lead Market Analyst, Food & Nutrition Division. This report was reviewed for data accuracy, regional segmentation integrity, forecast reliability, and alignment with current margarine industry standards, trans-fat regulatory frameworks, and plant-based spread market benchmarks.
List of Tables
Table 1 List of Abbreviation and acronyms
Table 2 List of Sources
Table 3 North America Global Margarine Market, by Segment Analysis, (USD Million) 2017-2035
Table 4 North America Global Margarine Market, by Region, (USD Million) 2017-2035
Table 5 U.S. Global Margarine Market, by Segment Analysis, (USD Million) 2017-2035
Table 6 Canada Global Margarine Market, by Segment Analysis, (USD Million) 2017-2035
Table 7 Europe Global Margarine Market, by Segment Analysis, (USD Million) 2017-2035
Table 8 Europe Global Margarine Market, by Region, (USD Million) 2017-2035
Table 9 Germany Global Margarine Market, by Segment Analysis, (USD Million) 2017-2035
Table 10 U.K. Global Margarine Market, by Segment Analysis, (USD Million) 2017-2035
Table 11 France Global Margarine Market, by Segment Analysis, (USD Million) 2017-2035
Table 12 Italy Global Margarine Market, by Segment Analysis, (USD Million) 2017-2035
Table 13 Spain Global Margarine Market, by Segment Analysis, (USD Million) 2017-2035
Table 14 Sweden Global Margarine Market, by Segment Analysis, (USD Million) 2017-2035
Table 15 Denmark Global Margarine Market, by Segment Analysis, (USD Million) 2017-2035
Table 16 Norway Global Margarine Market, by Segment Analysis, (USD Million) 2017-2035
Table 17 The Netherlands Global Margarine Market, by Segment Analysis, (USD Million) 2017-2035
Table 18 Russia Global Margarine Market, by Segment Analysis, (USD Million) 2017-2035
Table 19 Asia Pacific Global Margarine Market, by Segment Analysis, (USD Million) 2017-2035
Table 20 Asia Pacific Global Margarine Market, by Region, (USD Million) 2017-2035
Table 21 China Global Margarine Market, by Segment Analysis, (USD Million) 2017-2035
Table 22 Japan Global Margarine Market, by Segment Analysis, (USD Million) 2017-2035
Table 23 India Global Margarine Market, by Segment Analysis, (USD Million) 2017-2035
Table 24 Australia Global Margarine Market, by Segment Analysis, (USD Million) 2017-2035
Table 25 South Korea Global Margarine Market, by Segment Analysis, (USD Million) 2017-2035
Table 26 Thailand Global Margarine Market, by Segment Analysis, (USD Million) 2017-2035
Table 27 Latin America Global Margarine Market, by Segment Analysis, (USD Million) 2017-2035
Table 28 Latin America Global Margarine Market, by Region, (USD Million) 2017-2035
Table 29 Brazil Global Margarine Market, by Segment Analysis, (USD Million) 2017-2035
Table 30 Mexico Global Margarine Market, by Segment Analysis, (USD Million) 2017-2035
Table 31 Argentina Global Margarine Market, by Segment Analysis, (USD Million) 2017-2035
Table 32 Middle East and Africa Global Margarine Market, by Segment Analysis, (USD Million) 2017-2035
Table 33 Middle East and Africa Global Margarine Market, by Region, (USD Million) 2017-2035
Table 34 South Africa Global Margarine Market, by Segment Analysis, (USD Million) 2017-2035
Table 35 Saudi Arabia Global Margarine Market, by Segment Analysis, (USD Million) 2017-2035
Table 36 UAE Global Margarine Market, by Segment Analysis, (USD Million) 2017-2035
Table 37 Kuwait Global Margarine Market, by Segment Analysis, (USD Million) 2017-2035
Table 38 Turkey Global Margarine Market, by Segment Analysis, (USD Million) 2017-2035
Fig.1 Market research process
Fig.2 Market research approaches
Fig.3 Global Margarine Market: market scenario
Fig.4 Global Margarine Market competitive outlook
Fig.5 Global Margarine Market driver analysis
Fig.6 Global Margarine Market restraint analysis
Fig.7 Global Margarine Market opportunity analysis
Fig.8 Global Margarine Market trends analysis
Fig.9 Global Margarine Market: Segment Analysis (Based on the scope)
Fig.10 Global Margarine Market: regional analysis
Fig.11 Global market shares and leading market players
Fig.12 North America market share and leading players
Fig.13 Europe market share and leading players
Fig.14 Asia Pacific market share and leading players
Fig.15 Latin America market share and leading players
Fig.16 Middle East & Africa market share and leading players
Fig.17 North America, by country
Fig.18 North America
Fig.19 North America market estimates and forecast, 2017-2035
Fig.20 U.S.
Fig.21 Canada
Fig.22 Europe
Fig.23 Europe market estimates and forecast, 2017-2035
Fig.24 U.K.
Fig.25 Germany
Fig.26 France
Fig.27 Italy
Fig.28 Spain
Fig.29 Sweden
Fig.30 Denmark
Fig.31 Norway
Fig.32 The Netherlands
Fig.33 Russia
Fig.34 Asia Pacific
Fig.35 Asia Pacific market estimates and forecast, 2017-2035
Fig.36 China
Fig.37 Japan
Fig.38 India
Fig.39 Australia
Fig.40 South Korea
Fig.41 Thailand
Fig.42 Latin America
Fig.43 Latin America market estimates and forecast, 2017-2035
Fig.44 Brazil
Fig.45 Mexico
Fig.46 Argentina
Fig.47 Colombia
Fig.48 Middle East and Africa
Fig.49 Middle East and Africa market estimates and forecast, 2017-2035
Fig.50 Saudi Arabia
Fig.51 South Africa
Fig.52 UAE
Fig.53 Kuwait
Fig.54 Turkey
The Margarine Market size estimates were developed using a combination of primary industry interviews, company revenue analysis, trade data evaluation, pricing trend analysis, supply-demand modeling, and secondary research from government databases, financial filings, and food industry publications. According to Quintile Reports analysis, the global Margarine Market was valued at approximately USD 2.37 billion in 2026 and is projected to reach nearly USD 3.30 billion by 2036, expanding at a CAGR of 3.36% during the forecast period. All market forecasts were cross-verified through structured analyst review, regional demand analysis, and statistical forecasting models to ensure high-confidence estimates.
This report combines quantitative market modeling with qualitative industry insights gathered from manufacturers, procurement specialists, foodservice distributors, commercial bakery operators, and industry experts across North America, Europe, and Asia-Pacific. The research methodology emphasizes data validation, competitive benchmarking, regulatory analysis, and real-world supply chain trends to support strategic business decisions.
The Margarine Market is primarily driven by rising demand for plant-based and dairy-free spreads, expansion of industrial bakery and processed food sectors, increasing adoption of trans-fat-free formulations, and growing consumer preference for functional and fortified food products. Demand growth in Asia-Pacific and clean-label reformulation trends in Europe are also contributing significantly to long-term market expansion.
Europe and North America remain established markets due to high consumption of bakery and spread products, while Asia-Pacific is expected to record the fastest growth owing to rapid urbanization, rising disposable income, expansion of modern retail infrastructure, and increasing processed food consumption in countries such as China, India, and Indonesia.
Yes. The report incorporates insights from 40+ primary interviews conducted with margarine manufacturers, vegetable oil processors, procurement managers, food ingredient suppliers, commercial bakery operators, and industry specialists across major global regions. Market estimates and forecasts are validated through multiple independent sources and internal analyst review processes.
Margarine plays a critical role in commercial bakery production, processed foods, foodservice operations, and plant-based nutrition markets due to its functional performance, affordability, shelf stability, and adaptability across industrial food manufacturing applications. The market is also increasingly influenced by sustainability initiatives, vegan product innovation, and health-focused reformulation trends.
According to Quintile Reports analysis, the global Margarine Market was valued at approximately USD 2.37 billion in 2026 and is projected to reach nearly USD 3.30 billion by 2036, expanding at a CAGR of 3.36% during the forecast period. Growth is supported by rising plant-based food consumption, increasing demand for trans-fat-free spreads, and expansion of industrial bakery applications.
Walk into any supermarket today and the spreads aisle tells a surprisingly complex story. What once sat quietly next to butter as the "cheaper option" has quietly evolved into a category that the numbers now validate: the global margarine market is valued at USD 2.37 billion in 2026 and is projected to reach USD 3.30 billion by 2036, growing at a steady CAGR of 3.36% over the decade ahead.
That's not explosive growth and that's actually the point. This isn't a hype-driven category riding a single trend. It's a market expanding on durable, structural foundations: the global rise of industrial food manufacturing, a genuine plant-based repositioning, and health-driven reformulation that has fundamentally changed what margarine actually is.
The product itself has changed more than most consumers realize. Modern margarine formulations bear little resemblance to the hydrogenated, trans-fat-laden spreads that drew regulatory fire and consumer backlash through the 1990s and early 2000s. Today's versions are typically built on refined vegetable oils soybean, rapeseed, sunflower, and palm combined with water, emulsifiers, and often added vitamins A and D. Most commercially significant products are now trans-fat-free, and many are actively marketed on their unsaturated fat profiles.
This reformulation push wasn't cosmetic. Regulatory pressure in the EU, US, and other markets essentially forced manufacturers to either clean up their recipes or exit the category. Those that stayed invested heavily in emulsification technology, fat blend optimization, and texture engineering resulting in products that hold up in industrial baking, spread cleanly from the fridge, and deliver consistent results across pastry and confectionery applications.
The USD 2.37 billion figure reflects a market that has already survived its most existential challenge the trans-fat regulatory crisis and rebuilt on stronger ground. The path to USD 3.30 billion by 2036 runs through Asia-Pacific's expanding bakery sector, Europe's clean-label reformulation wave, and a plant-based consumer shift that has given this decades-old category an unexpected second chapter.
In commercial food manufacturing bakeries, snack producers, ready-meal kitchens margarine competes directly with butter on functional terms while offering a significant cost advantage. When commodity butter prices spike (as they have repeatedly in recent years), large-scale food producers don't switch back easily. Margarine's shelf stability and performance consistency give procurement teams reasons beyond just cost to stay loyal.
A product that was historically positioned as an industrial commodity is now being repositioned successfully in many markets as a dairy-free, vegan-friendly spread. This is particularly visible in Germany, where the vegan movement has real cultural traction, and in the UK, where plant-based claims are increasingly a mainstream retail expectation rather than a niche differentiator.
While consumer retail gets most of the marketing attention, a significant portion of margarine consumption happens invisibly inside cakes, biscuits, croissants, and packaged pastries. The expanding processed and convenience food industry across Asia-Pacific and Latin America is pulling margarine consumption along with it, even in markets where most consumers have never bought a tub for home use.
Margarine fortified with omega-3 fatty acids, plant sterols, or vitamins is a genuine product innovation, not just a label refresh. These variants allow manufacturers to move upmarket, command better margins, and reframe margarine as a proactive health choice rather than a concession.
Despite significant reformulation, a meaningful share of consumers particularly in urban premium markets associate margarine with artificiality. When shoppers are choosing between a product that lists twelve ingredients and one that lists two, the emulsifier-rich margarine often loses, regardless of its actual nutritional profile. This perception gap is a structural challenge, not just a marketing problem.
Palm oil and soybean oil the backbone of most margarine formulations are globally traded commodities subject to weather events, policy shifts, and geopolitical disruptions. A drought in Southeast Asia or an Indonesian export restriction can move input costs sharply in a matter of weeks. Manufacturers with integrated supply chains or long-term procurement contracts are significantly better positioned than those buying on spot markets.
A product formulation approved in one jurisdiction may require reformulation, relabeling, or re-documentation to enter another. For companies running global or multi-regional portfolios, compliance isn't a one-time cost it's an ongoing operational burden that particularly hits mid-sized players who lack dedicated regulatory teams.
North America is fundamentally a health-repositioning story. The core consumer case is shifting from "cheaper than butter" to "better for your cholesterol than butter," with fortified and trans-fat-free variants doing most of the heavy lifting. Vegan and lactose-intolerant consumers are also a growing addressable segment.
Europe is mature but not static. High per capita consumption in the Netherlands, Germany, and Scandinavia reflects deeply embedded bread-eating traditions. The more interesting dynamic here is the sustainability angle consumers and retailers alike are applying pressure on palm oil sourcing, pushing manufacturers toward RSPO-certified supply chains and alternative oil blends. Clean-label reformulation is ongoing across the region's major brands.
Asia-Pacific is the genuine growth engine of the global margarine market. Rising incomes, rapidly expanding bakery and convenience food sectors, and Western dietary influence are all pulling in the same direction. China, India, and Indonesia are the headline markets, but the underlying driver urbanization paired with expanding modern retail is a structural trend that still has years to run.
Latin America shows steady, if unspectacular, growth. Brazil and Mexico lead, driven by home baking culture, affordability, and gradual health awareness. The opportunity here is less about premium repositioning and more about market penetration and building long-term brand loyalty.
Middle East and Africa are early-stage markets with genuine long-run potential. Population growth, urbanization, and rising cardiovascular health awareness are the structural tailwinds. Fortified and trans-fat-free margarine products are gaining meaningful traction in urban centers across the Gulf and southern Africa.
The global margarine industry is shaped by a handful of large, vertically integrated players but how they compete varies sharply by segment:
In premium consumer retail, the game is brand equity, clean ingredient labels, and sustainability credentials. Upfield's 2024 launch of a fully recyclable, plastic-free paper tub for its Flora and Blue Band ranges is a clear illustration a packaging decision that signals a company-wide sustainability commitment rather than a simple product update.
In industrial and foodservice supply, the differentiators are reliability, technical fat performance, and procurement scale. Custom blends engineered for specific baking conditions, shelf-life targets, and processing temperatures matter far more than brand story.
In emerging markets, distribution depth and price accessibility are often the decisive factors. Reaching the right wholesale and modern trade channels with locally adapted formulations consistently outperforms brand-led strategies in price-sensitive geographies.
Margarine is a market that has survived a near-death experience the trans-fat regulatory crisis and emerged with a more defensible position than many observers expected. Growing from USD 2.37 billion in 2026 to USD 3.30 billion by 2036, its trajectory rests on four converging forces:
The companies that will define this category through 2036 are those that can maintain the supply chain efficiency and cost discipline that makes the industrial economics work while simultaneously building the clean-label, sustainability, and functional health credentials that modern consumers and retail buyers increasingly demand. That's a difficult balance. But the market's top performers are already navigating it and the gap between those who do it well and those who don't is only going to widen.
This section analyzes how leading companies differentiate through organic certification, cold-press and enzymatic extraction technologies, clean-label product positioning, non-GMO and allergen-free claims, flavor innovation, and value segments, helping stakeholders evaluate innovation, operational efficiency, and competitive market positioning.
The company profiles include business overview, product and service portfolios, financial performance, and geographic presence. The analysis also highlights recent developments such as partnerships, mergers, product launches, digital integration strategies, and regional expansion initiatives, helping stakeholders understand competitive intensity and benchmark leading industry participants.
| Report Scope | Details |
| Report Version | 2026 |
| Growth Rate | CAGR of 3.36% from 2026 to 2036 |
| Base Year | 2025 |
| Actual Estimates / Historical Data | 2017 - 2024 |
| Forecast Period | 2026 - 2036 |
| Quantitative Units | Revenue in USD million/billion & CAGR from 2026 to 2036 |
| Country Scope | North America (U.S., Canada), Europe (UK, Germany, France, Italy, Spain, Russia, Sweden, Denmark, Norway, Rest of Europe), Asia Pacific (Japan, China, India, Australia, South Korea, Thailand, Rest of Asia Pacific), Latin America (Brazil, Mexico, Argentina, Colombia, Rest of Latin America), Middle East & Africa (South Africa, Saudi Arabia, UAE, Kuwait, Rest of Middle East & Africa). |
| The Segment Covered by Product Type & Form |
|
| The Segment Covered by Source & Ingredient Base |
|
| Companies Covered |
|
| Report Coverage | Revenue forecast, company share, competitive landscape, growth factors, technology trends, and regional analysis |
| Free Customization Scope (Equivalent to 5 Analyst Working Days) | If you require additional insights beyond the current scope, our analysts can customize the report to meet your specific business needs. |
This margarine market report is built on a combination of primary and secondary research methodologies designed to ensure accuracy, depth, and real-world relevance:
The Margarine market report provides detailed insights into market size, share, and growth trends from 2026 to 2036, along with a comprehensive forecast outlook. The study combines historical analysis (2017 - 2024) with future projections to deliver a complete market perspective for stakeholders, investors, manufacturers, and strategic decision-makers. To request a sample PDF or obtain further information, contact our analyst team at sales@quintilereports.com.
Author: Anaya Shetty, Senior Market Analyst Food & Nutrition Industry
Last Updated: April 2026
Anaya Shetty has over 12 years of experience in food ingredient and consumer packaged goods market research, specializing in edible oils, margarine and spreads, bakery ingredients, plant-based dairy alternatives, and functional fat formulations. She leads the Food & Nutrition research division at Quintile Reports, overseeing analysis across commercial bakery inputs, table spreads, foodservice supply chains, and health-oriented fat innovation. The analysis draws on primary interviews conducted with margarine manufacturers, vegetable oil processors, commercial bakery procurement teams, foodservice distributors, and retail category managers across North America, Europe, and Asia-Pacific during Q1 2026.
Reviewed By: Anaya Shetty, Senior Lead Market Analyst, Food & Nutrition Division. This report was reviewed for data accuracy, regional segmentation integrity, forecast reliability, and alignment with current margarine industry standards, trans-fat regulatory frameworks, and plant-based spread market benchmarks.
Table 1 List of Abbreviation and acronyms
Table 2 List of Sources
Table 3 North America Global Margarine Market, by Segment Analysis, (USD Million) 2017-2035
Table 4 North America Global Margarine Market, by Region, (USD Million) 2017-2035
Table 5 U.S. Global Margarine Market, by Segment Analysis, (USD Million) 2017-2035
Table 6 Canada Global Margarine Market, by Segment Analysis, (USD Million) 2017-2035
Table 7 Europe Global Margarine Market, by Segment Analysis, (USD Million) 2017-2035
Table 8 Europe Global Margarine Market, by Region, (USD Million) 2017-2035
Table 9 Germany Global Margarine Market, by Segment Analysis, (USD Million) 2017-2035
Table 10 U.K. Global Margarine Market, by Segment Analysis, (USD Million) 2017-2035
Table 11 France Global Margarine Market, by Segment Analysis, (USD Million) 2017-2035
Table 12 Italy Global Margarine Market, by Segment Analysis, (USD Million) 2017-2035
Table 13 Spain Global Margarine Market, by Segment Analysis, (USD Million) 2017-2035
Table 14 Sweden Global Margarine Market, by Segment Analysis, (USD Million) 2017-2035
Table 15 Denmark Global Margarine Market, by Segment Analysis, (USD Million) 2017-2035
Table 16 Norway Global Margarine Market, by Segment Analysis, (USD Million) 2017-2035
Table 17 The Netherlands Global Margarine Market, by Segment Analysis, (USD Million) 2017-2035
Table 18 Russia Global Margarine Market, by Segment Analysis, (USD Million) 2017-2035
Table 19 Asia Pacific Global Margarine Market, by Segment Analysis, (USD Million) 2017-2035
Table 20 Asia Pacific Global Margarine Market, by Region, (USD Million) 2017-2035
Table 21 China Global Margarine Market, by Segment Analysis, (USD Million) 2017-2035
Table 22 Japan Global Margarine Market, by Segment Analysis, (USD Million) 2017-2035
Table 23 India Global Margarine Market, by Segment Analysis, (USD Million) 2017-2035
Table 24 Australia Global Margarine Market, by Segment Analysis, (USD Million) 2017-2035
Table 25 South Korea Global Margarine Market, by Segment Analysis, (USD Million) 2017-2035
Table 26 Thailand Global Margarine Market, by Segment Analysis, (USD Million) 2017-2035
Table 27 Latin America Global Margarine Market, by Segment Analysis, (USD Million) 2017-2035
Table 28 Latin America Global Margarine Market, by Region, (USD Million) 2017-2035
Table 29 Brazil Global Margarine Market, by Segment Analysis, (USD Million) 2017-2035
Table 30 Mexico Global Margarine Market, by Segment Analysis, (USD Million) 2017-2035
Table 31 Argentina Global Margarine Market, by Segment Analysis, (USD Million) 2017-2035
Table 32 Middle East and Africa Global Margarine Market, by Segment Analysis, (USD Million) 2017-2035
Table 33 Middle East and Africa Global Margarine Market, by Region, (USD Million) 2017-2035
Table 34 South Africa Global Margarine Market, by Segment Analysis, (USD Million) 2017-2035
Table 35 Saudi Arabia Global Margarine Market, by Segment Analysis, (USD Million) 2017-2035
Table 36 UAE Global Margarine Market, by Segment Analysis, (USD Million) 2017-2035
Table 37 Kuwait Global Margarine Market, by Segment Analysis, (USD Million) 2017-2035
Table 38 Turkey Global Margarine Market, by Segment Analysis, (USD Million) 2017-2035
Fig.1 Market research process
Fig.2 Market research approaches
Fig.3 Global Margarine Market: market scenario
Fig.4 Global Margarine Market competitive outlook
Fig.5 Global Margarine Market driver analysis
Fig.6 Global Margarine Market restraint analysis
Fig.7 Global Margarine Market opportunity analysis
Fig.8 Global Margarine Market trends analysis
Fig.9 Global Margarine Market: Segment Analysis (Based on the scope)
Fig.10 Global Margarine Market: regional analysis
Fig.11 Global market shares and leading market players
Fig.12 North America market share and leading players
Fig.13 Europe market share and leading players
Fig.14 Asia Pacific market share and leading players
Fig.15 Latin America market share and leading players
Fig.16 Middle East & Africa market share and leading players
Fig.17 North America, by country
Fig.18 North America
Fig.19 North America market estimates and forecast, 2017-2035
Fig.20 U.S.
Fig.21 Canada
Fig.22 Europe
Fig.23 Europe market estimates and forecast, 2017-2035
Fig.24 U.K.
Fig.25 Germany
Fig.26 France
Fig.27 Italy
Fig.28 Spain
Fig.29 Sweden
Fig.30 Denmark
Fig.31 Norway
Fig.32 The Netherlands
Fig.33 Russia
Fig.34 Asia Pacific
Fig.35 Asia Pacific market estimates and forecast, 2017-2035
Fig.36 China
Fig.37 Japan
Fig.38 India
Fig.39 Australia
Fig.40 South Korea
Fig.41 Thailand
Fig.42 Latin America
Fig.43 Latin America market estimates and forecast, 2017-2035
Fig.44 Brazil
Fig.45 Mexico
Fig.46 Argentina
Fig.47 Colombia
Fig.48 Middle East and Africa
Fig.49 Middle East and Africa market estimates and forecast, 2017-2035
Fig.50 Saudi Arabia
Fig.51 South Africa
Fig.52 UAE
Fig.53 Kuwait
Fig.54 Turkey

A license granted to one user. Rules or conditions might be applied for e.g. the use of electric files (PDFs) or printings, depending on product.
A license granted to multiple users.
A license granted to a single business site/establishment.
A license granted to all employees within organisation access to the product.
Immediate / Within 24-48 hours - Working days
Online Payments with PayPal and CCavenue
You can order a report by picking any of the payment methods which is bank wire or online payment through any Debit/Credit card or PayPal.
Hard Copy
Citrus Fiber Market Overview Citrus fiber is a plant-based, functional dietary ingredient recovered
Read MoreLiquid Mushroom Market Overview The global Liquid Mushroom Market was valued at USD 9.81 Billion in
Read MoreFresh Yeast Market Overview The global Fresh Yeast Market was valued at USD 4.10 Billion in 2026 and
Read More