The global recycled polyolefin market was valued at USD 72.35 billion in 2026 and is projected to reach USD 203.18 billion by 2036, expanding at a CAGR of 10.43% during the forecast period from 2026 to 2036. This growth is driven by increasing demand for sustainable plastics, stringent environmental regulations, and advancements in recycling technologies improving material quality and application scope.
The Recycled Polyolefin market report report delivers a holistic analysis of the industry, incorporating key factors such as macroeconomic trends, technological advancements, regulatory developments, and evolving consumer preferences to outline the future growth trajectory of the market.
Recycled polyolefins, primarily polyethylene (PE) and polypropylene (PP), are gaining renewed importance as industries look to balance performance requirements with sustainability expectations. These materials are recovered from post-consumer and industrial waste streams and processed into usable resins through a combination of mechanical and emerging chemical recycling methods. While historically considered secondary materials, improvements in processing quality are steadily expanding their application scope.
Recycled polyolefins are utilized across sectors such as packaging, automotive, construction, consumer goods, and agriculture. They are commonly processed into pellets, flakes, or granules and incorporated into products like containers, films, piping, panels, and molded components. The market includes both low-density and high-density recycled variants and supports efforts to reduce plastic waste and promote circular material use through re-integration of recovered plastics into manufacturing processes.
In practical terms, the Recycled Polyolefin market is no longer defined only by supply availability but by how effectively companies can integrate recycled inputs into existing value chains. This shift is pushing manufacturers, converters, and brand owners to rethink sourcing strategies, material standards, and long-term cost structures. At the same time, regulatory signals and voluntary sustainability commitments are quietly accelerating adoption across multiple industries.
Using 2025 as a reference point, the market shows a steady, if uneven, progression across regions. Demand is strongest where policy support, recycling infrastructure, and end-user awareness intersect. Companies are responding by investing in processing capacity, improving material consistency, and building partnerships that secure feedstock supply over the long term.
Looking forward, growth is expected to come less from sudden breakthroughs and more from gradual scaling—better collection systems, improved sorting technologies, and incremental gains in material performance. Businesses that manage to align operational efficiency with sustainability goals are likely to be better positioned as the market matures. The report examines these shifts in detail, covering structural drivers, constraints, and emerging opportunities across key regions and segments from 2017 to 2036.
The Recycled Polyolefin Market is closely interconnected with several adjacent industries, particularly within sustainable packaging and circular economy plastics. One of the strongest linkages exists in the flexible bulk packaging segment, where recycled polyethylene is increasingly used in large-scale transport and storage applications aligned with the flexible bulk packaging solutions market trends. This trend reflects the growing demand for sustainable material alternatives that reduce dependence on virgin plastics while maintaining performance efficiency.
In parallel, the plastic container and packaging industry, including the PET container packaging industry outlook, shows strong integration with recycled polyolefins. These materials are widely used in caps, closures, and secondary packaging components, supporting efforts to enhance recyclability and improve sustainability across the packaging value chain.
Beyond packaging, the market also maintains a significant relationship with advanced material applications in the automotive sector. Recycled polypropylene is increasingly incorporated into lightweight composite systems associated with the automotive lightweight composites market analysis. This integration contributes to vehicle weight reduction, cost efficiency, and improved environmental performance.
These interconnections highlight how recycled polyolefins are becoming deeply embedded across multiple industrial value chains. Their role in strengthening the global recycled plastic supply chain and advancing circular economy initiatives continues to expand as industries align sustainability goals with operational efficiency.

North America is a significant market for recycled polyolefins due to strong regulatory frameworks and increasing corporate commitments to sustainability. The U.S. leads the region with advanced recycling infrastructure and rising demand for recycled polyethylene (rPE) and polypropylene (rPP) in packaging, automotive, and construction. Brands and retailers are integrating more recycled content in products to meet both consumer expectations and ESG goals. Canada is also progressing through policies that encourage circular plastic use and local recycling programs.
Europe dominates the global recycled polyolefin market owing to strict EU directives on plastic waste reduction, packaging recovery targets, and bans on landfilling recyclable plastics. Countries like Germany, the Netherlands, and France are highly advanced in mechanical recycling and circular economy implementation. The demand for recycled content in rigid and flexible packaging, automotive parts, and building materials is strongly driven by the EU Green Deal and extended producer responsibility (EPR) schemes.
Asia-Pacific, particularly China, India, and Southeast Asian countries, is witnessing rapid market growth due to increasing plastic waste volumes, expanding packaging and manufacturing sectors, and growing awareness about sustainability. China has emerged as a major processor and exporter of recycled polyolefins, especially post its National Sword policy shift to manage domestic recycling. India is also developing its informal and formal recycling sectors, with rising demand for rPE and rPP in construction, consumer goods, and packaging.
Latin America shows moderate growth, led by Brazil, Mexico, and Chile, as countries move toward better waste management systems and eco-friendly alternatives. Although the recycling infrastructure is still developing, consumer brands and local governments are increasingly promoting recycled plastic use. The demand is growing in flexible packaging, household products, and automotive applications.
Middle East and Africa are emerging markets where recycling is gaining momentum, particularly in urban areas. The GCC countries like the UAE and Saudi Arabia are investing in plastic circularity and industrial recycling projects, with applications of recycled polyolefins in packaging and infrastructure. In Africa, countries such as South Africa and Kenya are adopting waste segregation and community-based recycling initiatives, gradually boosting demand for recycled polyolefins.
Infrastructure upgrades and regulations boost recycled polyolefin adoption in the U.S. The U.S. Environmental Protection Agency’s National Recycling Strategy plays a key role in driving the recycled polyolefin market by modernizing mechanical recycling facilities and incorporating advanced sorting technologies to improve the quality and supply of post-consumer polyolefins.
Additionally, state-level mandates such as California’s requirement for 50% post-consumer recycled content in plastic packaging by 2032 are creating strong demand for recycled materials. Major chemical companies are also investing in circular economy initiatives and setting up new recycled polypropylene plants to support sustainable packaging and automotive applications. These combined efforts across policy, technology, and industry make recycled polyolefins a strategic priority in the U.S. market.
Regulations and collection systems drive recycled polyolefin uptake in Germany:Germany’s National Circular Economy Strategy and alignment with upcoming EU Packaging and Packaging Waste Regulation (PPWR) are major drivers of recycled polyolefin demand. These policies enforce minimum requirements for post-consumer recyclate content and actively promote both mechanical and chemical recycling technologies.
The country’s efficient dual collection system, supported by programs like the Green Dot scheme, ensures a steady and high-quality supply of recyclable polyolefins. With mechanical recycling rates climbing steadily, Germany maintains a strong position in the production and consumption of recycled HDPE and PP across packaging, automotive, and consumer goods sectors.
Technological innovation and corporate sustainability goals support recycled polyolefin use in Japan:Japan’s emphasis on advanced recycling technologies and circular economy practices plays a central role in driving recycled polyolefin demand. The country leads in integrating chemical and mechanical recycling solutions to recover polyolefins from complex waste streams, enhancing both quality and efficiency.
Major Japanese manufacturers in packaging, automotive, and consumer goods sectors are committing to sustainability targets that include increased use of recycled materials. Government incentives and industry partnerships further promote closed-loop systems, making recycled HDPE and PP an essential part of Japan’s transition toward low-carbon, resource-efficient manufacturing.
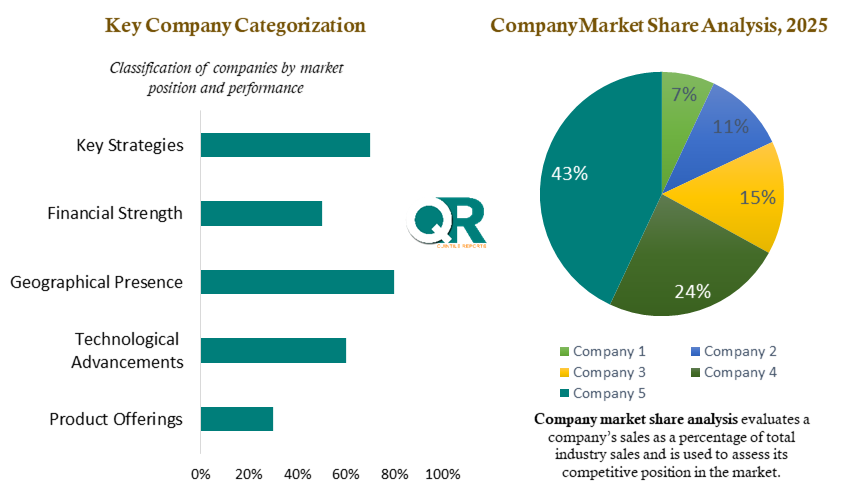
The Recycled Polyolefin Market is highly competitive based on innovation in recycling technologies, material consistency, and performance in end-use applications such as packaging, automotive, and construction. Companies are increasingly focusing on advanced mechanical and chemical recycling methods to improve polymer quality and meet stringent application standards.
This shift allows manufacturers to compete in R&D capabilities, process optimization for contaminant removal, and ability to tailor recycled polyolefins for specific mechanical and thermal properties demanded by industrial buyers.
Price competitiveness continues to be a vital factor, particularly in the packaging and consumer goods sectors, where cost-sensitive bulk demand prevails. Manufacturers that can maintain cost efficiency while ensuring environmental compliance and product consistency hold a strategic advantage.
An additional differentiator is vertical integration and long-term sourcing partnerships with waste management and collection agencies. Companies that have established robust supply chains and access to high-quality feedstock are better positioned to scale operations and ensure uninterrupted supply.
Brand positioning based on sustainability credentials, certifications (such as Global Recycled Standard), and the ability to meet corporate ESG targets are increasingly influencing buyer decisions. Overall, competition in the recycled polyolefin market is intensifying with a focus on quality assurance, scalability, environmental compliance, and customer-specific application development.
Key players in the market are Veolia, Suez, Borealis AG, LyondellBasell Industries, KW Plastics, Berry Global Inc., Greenpath Recovery, MBA Polymers Inc., Plastipak Holdings, Inc., Ravago Group, Indorama Ventures Public Company Limited, Envision Plastics, DS Smith, B&B Plastics, PureCycle Technologies.
In July 2025, Veolia announced it will invest £70 million to build the UK’s first “tray-to-tray” closed-loop PET recycling facility at Shropshire, processing 80,000 tonnes per year and creating over 130 local jobs, with operations expected to begin in early 2026 as part of a £1 billion UK circular economy strategy.
In June 2025, PureCycle Technologies, Inc. (listed among your companies) received GreenCircle certification for several grades of its PureFive™ recycled polypropylene resin, and confirmed a joint venture with Thailand’s IRPC to build a 130-million lb/year production line in Rayong—backed by $300 million financing to scale globally.

This report delivers a data-driven and forward-looking analysis of the Recycled Polyolefin market, combining primary research, industry expertise, and advanced analytical models. It evaluates current market conditions, including developments in recycled polyethylene (PE) and polypropylene (PP), emerging recycling technologies, and evolving competitive dynamics across the global recycled plastics industry. The study is designed to support business leaders, investors, and stakeholders in identifying growth opportunities, optimizing decision-making, and navigating market uncertainties within the circular economy and sustainable materials landscape.
This chapter provides a detailed evaluation of the key forces influencing the Recycled Polyolefin market. It covers major growth drivers such as increasing demand for sustainable plastics, advancements in recycling technologies, and regulatory support for circular economy initiatives, along with market constraints including feedstock availability and quality inconsistencies. The section also highlights emerging opportunities across packaging, automotive, and construction sectors. In addition, it includes insights into market size trends, competitive positioning, and strategic developments among key players in the recycled plastics industry. Analytical frameworks such as SWOT analysis, Porter’s Five Forces, PESTEL analysis, and Ansoff Matrix are applied to assess the business environment. The chapter further examines the impact of macroeconomic and geopolitical factors, including inflation trends, global trade dynamics, and supply chain disruptions, and their influence on overall market performance.
This section presents a comprehensive breakdown of the Recycled Polyolefin market into key segments, including material type (polyethylene and polypropylene), source (post-consumer and post-industrial waste), processing method (mechanical and chemical recycling), and end-use industries such as packaging, automotive, construction, and consumer goods. It offers detailed insights into segment performance and future growth potential by defining each category, outlining underlying assumptions, and evaluating historical and forecast trends. The analysis highlights advancements in recycling technologies, adoption patterns across industries, and market penetration levels of recycled plastics. Additionally, it explores evolving consumer preferences for sustainable materials, key growth drivers, and potential challenges such as feedstock variability and regulatory compliance, enabling stakeholders to identify high-growth segments and make targeted strategic decisions.
This chapter examines regional variations in the performance of the Recycled Polyolefin market, providing a detailed outlook across major geographies. It analyzes demand patterns for recycled polyethylene (PE) and polypropylene (PP), regional recycling infrastructure, economic conditions, regulatory frameworks, and competitive landscapes at both regional and country levels. The report covers North America, Europe, Asia Pacific, Latin America, and Middle East & Africa, highlighting region-specific growth drivers such as sustainability regulations, waste management policies, and industrial adoption of recycled plastics. It also evaluates key challenges including feedstock availability, collection efficiency, and technological gaps in recycling systems. This regional insight enables businesses to align their strategies with localized market dynamics, supply chain conditions, and expansion opportunities within the global circular economy.
This report is developed using a rigorous and structured research methodology that combines both primary and secondary data sources to ensure accuracy and reliability. Primary research includes direct interactions with industry stakeholders such as manufacturers, recyclers, suppliers, distributors, and end-users across the recycled polyolefin value chain. Expert interviews and industry consultations are conducted to validate market trends, demand patterns, and pricing dynamics for recycled polyethylene (PE) and polypropylene (PP).
Secondary research involves the analysis of company reports, industry publications, government databases, trade journals, and regulatory documents related to plastic recycling and sustainability initiatives. Data triangulation techniques are applied to cross-verify information and minimize deviations, ensuring a high level of data integrity. The study also incorporates historical data analysis and forecast modeling using advanced statistical tools to project market trends through 2035.
In addition, the methodology integrates qualitative and quantitative assessments, including market sizing, segmentation analysis, and competitive benchmarking. Key analytical frameworks are applied to evaluate industry structure, technological advancements in mechanical and chemical recycling, and the impact of regulatory policies on market growth. This comprehensive approach ensures that the report delivers actionable insights aligned with real-world market dynamics and evolving circular economy practices.

This section delivers an in-depth assessment of the competitive landscape within the Recycled Polyolefin market. It identifies key players and evaluates their market positioning, strategic initiatives, and core strengths. The company profiles include business overview, product and service portfolios, financial performance, and geographic presence. The analysis also highlights recent developments such as partnerships, mergers, product launches, and expansion strategies, helping stakeholders understand competitive intensity and benchmark industry leaders.
The recycled polyolefin market is evolving from a supply-driven recycling industry into a demand-driven circular economy ecosystem. Increasing adoption across packaging, automotive, and construction sectors highlights the growing importance of sustainable material integration.
From an industry perspective, regulatory mandates and corporate sustainability goals are accelerating adoption. Companies are increasingly using recycled polyolefins to reduce reliance on virgin plastics and strengthen ESG positioning.
Advancements in recycling technologies such as chemical recycling and improved sorting systems are enhancing material quality, enabling wider application across high-performance industries.
Despite challenges such as feedstock variability and infrastructure limitations, the long-term outlook remains strong, supported by global sustainability initiatives and circular economy policies.
Conclusion: Companies that align innovation, supply chain integration, and sustainability strategies will be best positioned to capture long-term growth in the recycled polyolefin market.
| Report Scope | Details |
| Report Version | 2026 |
| Growth Rate | CAGR of 10.43 from 2026 to 2035 |
| Base Year | 2025 |
| Actual Estimates / Historical Data | 2017 - 2024 |
| Forecast Period | 2026 - 2035 |
| Quantitative Units | Revenue in USD million/billion & CAGR from 2026 to 2035 |
| Country Scope | North America (U.S., Canada), Europe (UK, Germany, France, Italy, Spain, Russia, Sweden, Denmark, Norway, Rest of Europe), Asia Pacific (Japan, China, India, Australia, South Korea, Thailand, Rest of Asia Pacific), Latin America (Brazil, Mexico, Argentina, Colombia, Rest of Latin America), Middle East & Africa (South Africa, Saudi Arabia, UAE, Kuwait, Rest of Middle East & Africa). |
| The Segment Covered by Material Type |
|
| The Segment Covered by Source |
|
| Companies Covered |
|
| Report Coverage | Revenue forecast, company share, competitive landscape, growth factors, and trends |
| Free Customization Scope (Equivalent to 5 Analyst Working Days) | If you require additional insights beyond the current scope, our analysts can customize the report to meet your specific business needs. |

The Recycled Polyolefin market report provides detailed insights into market size, share, and growth trends for 2025, along with a comprehensive forecast outlook through 2035. The study combines historical analysis with future projections to deliver a complete market perspective. To request a sample PDF or obtain further information, contact our analyst team at sales@quintilereports.com.
The global recycled polyolefin market is expected to grow at a CAGR of 10.43% from 2026 to 2036, driven by rising demand for sustainable materials and regulatory pressure.
Recycled polyolefins include materials such as recycled polyethylene (rPE) and recycled polypropylene (rPP), derived from post-consumer and industrial plastic waste. They play a critical role in reducing plastic pollution and supporting circular economy initiatives.
Major industries include packaging, automotive, construction, consumer goods, and agriculture, with packaging being the dominant segment.
Growth is driven by strict plastic regulations, increasing sustainability awareness, advancements in recycling technologies, and rising corporate ESG commitments.
Key challenges include inconsistent material quality, limited recycling infrastructure in emerging economies, high processing costs, and complex sorting requirements.
Europe leads due to strong regulations, followed by North America, while Asia-Pacific is the fastest-growing region.
The market is expected to grow steadily with advancements in chemical recycling, improved waste management systems, and increased adoption across industries.
List of Tables
Table 1 List of Abbreviation and acronyms
Table 2 List of Sources
Table 3 North America Global Recycled Polyolefin Market, by Segment Analysis, (USD Million) 2017-2035
Table 4 North America Global Recycled Polyolefin Market, by Region, (USD Million) 2017-2035
Table 5 U.S. Global Recycled Polyolefin Market, by Segment Analysis, (USD Million) 2017-2035
Table 6 Canada Global Recycled Polyolefin Market, by Segment Analysis, (USD Million) 2017-2035
Table 7 Europe Global Recycled Polyolefin Market, by Segment Analysis, (USD Million) 2017-2035
Table 8 Europe Global Recycled Polyolefin Market, by Region, (USD Million) 2017-2035
Table 9 Germany Global Recycled Polyolefin Market, by Segment Analysis, (USD Million) 2017-2035
Table 10 U.K. Global Recycled Polyolefin Market, by Segment Analysis, (USD Million) 2017-2035
Table 11 France Global Recycled Polyolefin Market, by Segment Analysis, (USD Million) 2017-2035
Table 12 Italy Global Recycled Polyolefin Market, by Segment Analysis, (USD Million) 2017-2035
Table 13 Spain Global Recycled Polyolefin Market, by Segment Analysis, (USD Million) 2017-2035
Table 14 Sweden Global Recycled Polyolefin Market, by Segment Analysis, (USD Million) 2017-2035
Table 15 Denmark Global Recycled Polyolefin Market, by Segment Analysis, (USD Million) 2017-2035
Table 16 Norway Global Recycled Polyolefin Market, by Segment Analysis, (USD Million) 2017-2035
Table 17 The Netherlands Global Recycled Polyolefin Market, by Segment Analysis, (USD Million) 2017-2035
Table 18 Russia Global Recycled Polyolefin Market, by Segment Analysis, (USD Million) 2017-2035
Table 19 Asia Pacific Global Recycled Polyolefin Market, by Segment Analysis, (USD Million) 2017-2035
Table 20 Asia Pacific Global Recycled Polyolefin Market, by Region, (USD Million) 2017-2035
Table 21 China Global Recycled Polyolefin Market, by Segment Analysis, (USD Million) 2017-2035
Table 22 Japan Global Recycled Polyolefin Market, by Segment Analysis, (USD Million) 2017-2035
Table 23 India Global Recycled Polyolefin Market, by Segment Analysis, (USD Million) 2017-2035
Table 24 Australia Global Recycled Polyolefin Market, by Segment Analysis, (USD Million) 2017-2035
Table 25 South Korea Global Recycled Polyolefin Market, by Segment Analysis, (USD Million) 2017-2035
Table 26 Thailand Global Recycled Polyolefin Market, by Segment Analysis, (USD Million) 2017-2035
Table 27 Latin America Global Recycled Polyolefin Market, by Segment Analysis, (USD Million) 2017-2035
Table 28 Latin America Global Recycled Polyolefin Market, by Region, (USD Million) 2017-2035
Table 29 Brazil Global Recycled Polyolefin Market, by Segment Analysis, (USD Million) 2017-2035
Table 30 Mexico Global Recycled Polyolefin Market, by Segment Analysis, (USD Million) 2017-2035
Table 31 Argentina Global Recycled Polyolefin Market, by Segment Analysis, (USD Million) 2017-2035
Table 32 Middle East and Africa Global Recycled Polyolefin Market, by Segment Analysis, (USD Million) 2017-2035
Table 33 Middle East and Africa Global Recycled Polyolefin Market, by Region, (USD Million) 2017-2035
Table 34 South Africa Global Recycled Polyolefin Market, by Segment Analysis, (USD Million) 2017-2035
Table 35 Saudi Arabia Global Recycled Polyolefin Market, by Segment Analysis, (USD Million) 2017-2035
Table 36 UAE Global Recycled Polyolefin Market, by Segment Analysis, (USD Million) 2017-2035
Table 37 Kuwait Global Recycled Polyolefin Market, by Segment Analysis, (USD Million) 2017-2035
Table 38 Turkey Global Recycled Polyolefin Market, by Segment Analysis, (USD Million) 2017-2035
Fig.1 Market research process
Fig.2 Market research approaches
Fig.3 Global Recycled Polyolefin Market: market scenario
Fig.4 Global Recycled Polyolefin Market competitive outlook
Fig.5 Global Recycled Polyolefin Market driver analysis
Fig.6 Global Recycled Polyolefin Market restraint analysis
Fig.7 Global Recycled Polyolefin Market opportunity analysis
Fig.8 Global Recycled Polyolefin Market trends analysis
Fig.9 Global Recycled Polyolefin Market: Segment Analysis (Based on the scope)
Fig.10 Global Recycled Polyolefin Market: regional analysis
Fig.11 Global market shares and leading market players
Fig.12 North America market share and leading players
Fig.13 Europe market share and leading players
Fig.14 Asia Pacific market share and leading players
Fig.15 Latin America market share and leading players
Fig.16 Middle East & Africa market share and leading players
Fig.17 North America, by country
Fig.18 North America
Fig.19 North America market estimates and forecast, 2017-2035
Fig.20 U.S.
Fig.21 Canada
Fig.22 Europe
Fig.23 Europe market estimates and forecast, 2017-2035
Fig.24 U.K.
Fig.25 Germany
Fig.26 France
Fig.27 Italy
Fig.28 Spain
Fig.29 Sweden
Fig.30 Denmark
Fig.31 Norway
Fig.32 The Netherlands
Fig.33 Russia
Fig.34 Asia Pacific
Fig.35 Asia Pacific market estimates and forecast, 2017-2035
Fig.36 China
Fig.37 Japan
Fig.38 India
Fig.39 Australia
Fig.40 South Korea
Fig.41 Thailand
Fig.42 Latin America
Fig.43 Latin America market estimates and forecast, 2017-2035
Fig.44 Brazil
Fig.45 Mexico
Fig.46 Argentina
Fig.47 Colombia
Fig.48 Middle East and Africa
Fig.49 Middle East and Africa market estimates and forecast, 2017-2035
Fig.50 Saudi Arabia
Fig.51 South Africa
Fig.52 UAE
Fig.53 Kuwait
Fig.54 Turkey
The global recycled polyolefin market was valued at USD 72.35 billion in 2026 and is projected to reach USD 203.18 billion by 2036, expanding at a CAGR of 10.43% during the forecast period from 2026 to 2036. This growth is driven by increasing demand for sustainable plastics, stringent environmental regulations, and advancements in recycling technologies improving material quality and application scope.
The Recycled Polyolefin market report report delivers a holistic analysis of the industry, incorporating key factors such as macroeconomic trends, technological advancements, regulatory developments, and evolving consumer preferences to outline the future growth trajectory of the market.
Recycled polyolefins, primarily polyethylene (PE) and polypropylene (PP), are gaining renewed importance as industries look to balance performance requirements with sustainability expectations. These materials are recovered from post-consumer and industrial waste streams and processed into usable resins through a combination of mechanical and emerging chemical recycling methods. While historically considered secondary materials, improvements in processing quality are steadily expanding their application scope.
Recycled polyolefins are utilized across sectors such as packaging, automotive, construction, consumer goods, and agriculture. They are commonly processed into pellets, flakes, or granules and incorporated into products like containers, films, piping, panels, and molded components. The market includes both low-density and high-density recycled variants and supports efforts to reduce plastic waste and promote circular material use through re-integration of recovered plastics into manufacturing processes.
In practical terms, the Recycled Polyolefin market is no longer defined only by supply availability but by how effectively companies can integrate recycled inputs into existing value chains. This shift is pushing manufacturers, converters, and brand owners to rethink sourcing strategies, material standards, and long-term cost structures. At the same time, regulatory signals and voluntary sustainability commitments are quietly accelerating adoption across multiple industries.
Using 2025 as a reference point, the market shows a steady, if uneven, progression across regions. Demand is strongest where policy support, recycling infrastructure, and end-user awareness intersect. Companies are responding by investing in processing capacity, improving material consistency, and building partnerships that secure feedstock supply over the long term.
Looking forward, growth is expected to come less from sudden breakthroughs and more from gradual scaling—better collection systems, improved sorting technologies, and incremental gains in material performance. Businesses that manage to align operational efficiency with sustainability goals are likely to be better positioned as the market matures. The report examines these shifts in detail, covering structural drivers, constraints, and emerging opportunities across key regions and segments from 2017 to 2036.
The Recycled Polyolefin Market is closely interconnected with several adjacent industries, particularly within sustainable packaging and circular economy plastics. One of the strongest linkages exists in the flexible bulk packaging segment, where recycled polyethylene is increasingly used in large-scale transport and storage applications aligned with the flexible bulk packaging solutions market trends. This trend reflects the growing demand for sustainable material alternatives that reduce dependence on virgin plastics while maintaining performance efficiency.
In parallel, the plastic container and packaging industry, including the PET container packaging industry outlook, shows strong integration with recycled polyolefins. These materials are widely used in caps, closures, and secondary packaging components, supporting efforts to enhance recyclability and improve sustainability across the packaging value chain.
Beyond packaging, the market also maintains a significant relationship with advanced material applications in the automotive sector. Recycled polypropylene is increasingly incorporated into lightweight composite systems associated with the automotive lightweight composites market analysis. This integration contributes to vehicle weight reduction, cost efficiency, and improved environmental performance.
These interconnections highlight how recycled polyolefins are becoming deeply embedded across multiple industrial value chains. Their role in strengthening the global recycled plastic supply chain and advancing circular economy initiatives continues to expand as industries align sustainability goals with operational efficiency.
North America is a significant market for recycled polyolefins due to strong regulatory frameworks and increasing corporate commitments to sustainability. The U.S. leads the region with advanced recycling infrastructure and rising demand for recycled polyethylene (rPE) and polypropylene (rPP) in packaging, automotive, and construction. Brands and retailers are integrating more recycled content in products to meet both consumer expectations and ESG goals. Canada is also progressing through policies that encourage circular plastic use and local recycling programs.
Europe dominates the global recycled polyolefin market owing to strict EU directives on plastic waste reduction, packaging recovery targets, and bans on landfilling recyclable plastics. Countries like Germany, the Netherlands, and France are highly advanced in mechanical recycling and circular economy implementation. The demand for recycled content in rigid and flexible packaging, automotive parts, and building materials is strongly driven by the EU Green Deal and extended producer responsibility (EPR) schemes.
Asia-Pacific, particularly China, India, and Southeast Asian countries, is witnessing rapid market growth due to increasing plastic waste volumes, expanding packaging and manufacturing sectors, and growing awareness about sustainability. China has emerged as a major processor and exporter of recycled polyolefins, especially post its National Sword policy shift to manage domestic recycling. India is also developing its informal and formal recycling sectors, with rising demand for rPE and rPP in construction, consumer goods, and packaging.
Latin America shows moderate growth, led by Brazil, Mexico, and Chile, as countries move toward better waste management systems and eco-friendly alternatives. Although the recycling infrastructure is still developing, consumer brands and local governments are increasingly promoting recycled plastic use. The demand is growing in flexible packaging, household products, and automotive applications.
Middle East and Africa are emerging markets where recycling is gaining momentum, particularly in urban areas. The GCC countries like the UAE and Saudi Arabia are investing in plastic circularity and industrial recycling projects, with applications of recycled polyolefins in packaging and infrastructure. In Africa, countries such as South Africa and Kenya are adopting waste segregation and community-based recycling initiatives, gradually boosting demand for recycled polyolefins.
Infrastructure upgrades and regulations boost recycled polyolefin adoption in the U.S. The U.S. Environmental Protection Agency’s National Recycling Strategy plays a key role in driving the recycled polyolefin market by modernizing mechanical recycling facilities and incorporating advanced sorting technologies to improve the quality and supply of post-consumer polyolefins.
Additionally, state-level mandates such as California’s requirement for 50% post-consumer recycled content in plastic packaging by 2032 are creating strong demand for recycled materials. Major chemical companies are also investing in circular economy initiatives and setting up new recycled polypropylene plants to support sustainable packaging and automotive applications. These combined efforts across policy, technology, and industry make recycled polyolefins a strategic priority in the U.S. market.
Regulations and collection systems drive recycled polyolefin uptake in Germany:Germany’s National Circular Economy Strategy and alignment with upcoming EU Packaging and Packaging Waste Regulation (PPWR) are major drivers of recycled polyolefin demand. These policies enforce minimum requirements for post-consumer recyclate content and actively promote both mechanical and chemical recycling technologies.
The country’s efficient dual collection system, supported by programs like the Green Dot scheme, ensures a steady and high-quality supply of recyclable polyolefins. With mechanical recycling rates climbing steadily, Germany maintains a strong position in the production and consumption of recycled HDPE and PP across packaging, automotive, and consumer goods sectors.
Technological innovation and corporate sustainability goals support recycled polyolefin use in Japan:Japan’s emphasis on advanced recycling technologies and circular economy practices plays a central role in driving recycled polyolefin demand. The country leads in integrating chemical and mechanical recycling solutions to recover polyolefins from complex waste streams, enhancing both quality and efficiency.
Major Japanese manufacturers in packaging, automotive, and consumer goods sectors are committing to sustainability targets that include increased use of recycled materials. Government incentives and industry partnerships further promote closed-loop systems, making recycled HDPE and PP an essential part of Japan’s transition toward low-carbon, resource-efficient manufacturing.
The Recycled Polyolefin Market is highly competitive based on innovation in recycling technologies, material consistency, and performance in end-use applications such as packaging, automotive, and construction. Companies are increasingly focusing on advanced mechanical and chemical recycling methods to improve polymer quality and meet stringent application standards.
This shift allows manufacturers to compete in R&D capabilities, process optimization for contaminant removal, and ability to tailor recycled polyolefins for specific mechanical and thermal properties demanded by industrial buyers.
Price competitiveness continues to be a vital factor, particularly in the packaging and consumer goods sectors, where cost-sensitive bulk demand prevails. Manufacturers that can maintain cost efficiency while ensuring environmental compliance and product consistency hold a strategic advantage.
An additional differentiator is vertical integration and long-term sourcing partnerships with waste management and collection agencies. Companies that have established robust supply chains and access to high-quality feedstock are better positioned to scale operations and ensure uninterrupted supply.
Brand positioning based on sustainability credentials, certifications (such as Global Recycled Standard), and the ability to meet corporate ESG targets are increasingly influencing buyer decisions. Overall, competition in the recycled polyolefin market is intensifying with a focus on quality assurance, scalability, environmental compliance, and customer-specific application development.
Key players in the market are Veolia, Suez, Borealis AG, LyondellBasell Industries, KW Plastics, Berry Global Inc., Greenpath Recovery, MBA Polymers Inc., Plastipak Holdings, Inc., Ravago Group, Indorama Ventures Public Company Limited, Envision Plastics, DS Smith, B&B Plastics, PureCycle Technologies.
In July 2025, Veolia announced it will invest £70 million to build the UK’s first “tray-to-tray” closed-loop PET recycling facility at Shropshire, processing 80,000 tonnes per year and creating over 130 local jobs, with operations expected to begin in early 2026 as part of a £1 billion UK circular economy strategy.
In June 2025, PureCycle Technologies, Inc. (listed among your companies) received GreenCircle certification for several grades of its PureFive™ recycled polypropylene resin, and confirmed a joint venture with Thailand’s IRPC to build a 130-million lb/year production line in Rayong—backed by $300 million financing to scale globally.
This report delivers a data-driven and forward-looking analysis of the Recycled Polyolefin market, combining primary research, industry expertise, and advanced analytical models. It evaluates current market conditions, including developments in recycled polyethylene (PE) and polypropylene (PP), emerging recycling technologies, and evolving competitive dynamics across the global recycled plastics industry. The study is designed to support business leaders, investors, and stakeholders in identifying growth opportunities, optimizing decision-making, and navigating market uncertainties within the circular economy and sustainable materials landscape.
This chapter provides a detailed evaluation of the key forces influencing the Recycled Polyolefin market. It covers major growth drivers such as increasing demand for sustainable plastics, advancements in recycling technologies, and regulatory support for circular economy initiatives, along with market constraints including feedstock availability and quality inconsistencies. The section also highlights emerging opportunities across packaging, automotive, and construction sectors. In addition, it includes insights into market size trends, competitive positioning, and strategic developments among key players in the recycled plastics industry. Analytical frameworks such as SWOT analysis, Porter’s Five Forces, PESTEL analysis, and Ansoff Matrix are applied to assess the business environment. The chapter further examines the impact of macroeconomic and geopolitical factors, including inflation trends, global trade dynamics, and supply chain disruptions, and their influence on overall market performance.
This section presents a comprehensive breakdown of the Recycled Polyolefin market into key segments, including material type (polyethylene and polypropylene), source (post-consumer and post-industrial waste), processing method (mechanical and chemical recycling), and end-use industries such as packaging, automotive, construction, and consumer goods. It offers detailed insights into segment performance and future growth potential by defining each category, outlining underlying assumptions, and evaluating historical and forecast trends. The analysis highlights advancements in recycling technologies, adoption patterns across industries, and market penetration levels of recycled plastics. Additionally, it explores evolving consumer preferences for sustainable materials, key growth drivers, and potential challenges such as feedstock variability and regulatory compliance, enabling stakeholders to identify high-growth segments and make targeted strategic decisions.
This chapter examines regional variations in the performance of the Recycled Polyolefin market, providing a detailed outlook across major geographies. It analyzes demand patterns for recycled polyethylene (PE) and polypropylene (PP), regional recycling infrastructure, economic conditions, regulatory frameworks, and competitive landscapes at both regional and country levels. The report covers North America, Europe, Asia Pacific, Latin America, and Middle East & Africa, highlighting region-specific growth drivers such as sustainability regulations, waste management policies, and industrial adoption of recycled plastics. It also evaluates key challenges including feedstock availability, collection efficiency, and technological gaps in recycling systems. This regional insight enables businesses to align their strategies with localized market dynamics, supply chain conditions, and expansion opportunities within the global circular economy.
This report is developed using a rigorous and structured research methodology that combines both primary and secondary data sources to ensure accuracy and reliability. Primary research includes direct interactions with industry stakeholders such as manufacturers, recyclers, suppliers, distributors, and end-users across the recycled polyolefin value chain. Expert interviews and industry consultations are conducted to validate market trends, demand patterns, and pricing dynamics for recycled polyethylene (PE) and polypropylene (PP).
Secondary research involves the analysis of company reports, industry publications, government databases, trade journals, and regulatory documents related to plastic recycling and sustainability initiatives. Data triangulation techniques are applied to cross-verify information and minimize deviations, ensuring a high level of data integrity. The study also incorporates historical data analysis and forecast modeling using advanced statistical tools to project market trends through 2035.
In addition, the methodology integrates qualitative and quantitative assessments, including market sizing, segmentation analysis, and competitive benchmarking. Key analytical frameworks are applied to evaluate industry structure, technological advancements in mechanical and chemical recycling, and the impact of regulatory policies on market growth. This comprehensive approach ensures that the report delivers actionable insights aligned with real-world market dynamics and evolving circular economy practices.
This section delivers an in-depth assessment of the competitive landscape within the Recycled Polyolefin market. It identifies key players and evaluates their market positioning, strategic initiatives, and core strengths. The company profiles include business overview, product and service portfolios, financial performance, and geographic presence. The analysis also highlights recent developments such as partnerships, mergers, product launches, and expansion strategies, helping stakeholders understand competitive intensity and benchmark industry leaders.
The recycled polyolefin market is evolving from a supply-driven recycling industry into a demand-driven circular economy ecosystem. Increasing adoption across packaging, automotive, and construction sectors highlights the growing importance of sustainable material integration.
From an industry perspective, regulatory mandates and corporate sustainability goals are accelerating adoption. Companies are increasingly using recycled polyolefins to reduce reliance on virgin plastics and strengthen ESG positioning.
Advancements in recycling technologies such as chemical recycling and improved sorting systems are enhancing material quality, enabling wider application across high-performance industries.
Despite challenges such as feedstock variability and infrastructure limitations, the long-term outlook remains strong, supported by global sustainability initiatives and circular economy policies.
Conclusion: Companies that align innovation, supply chain integration, and sustainability strategies will be best positioned to capture long-term growth in the recycled polyolefin market.
| Report Scope | Details |
| Report Version | 2026 |
| Growth Rate | CAGR of 10.43 from 2026 to 2035 |
| Base Year | 2025 |
| Actual Estimates / Historical Data | 2017 - 2024 |
| Forecast Period | 2026 - 2035 |
| Quantitative Units | Revenue in USD million/billion & CAGR from 2026 to 2035 |
| Country Scope | North America (U.S., Canada), Europe (UK, Germany, France, Italy, Spain, Russia, Sweden, Denmark, Norway, Rest of Europe), Asia Pacific (Japan, China, India, Australia, South Korea, Thailand, Rest of Asia Pacific), Latin America (Brazil, Mexico, Argentina, Colombia, Rest of Latin America), Middle East & Africa (South Africa, Saudi Arabia, UAE, Kuwait, Rest of Middle East & Africa). |
| The Segment Covered by Material Type |
|
| The Segment Covered by Source |
|
| Companies Covered |
|
| Report Coverage | Revenue forecast, company share, competitive landscape, growth factors, and trends |
| Free Customization Scope (Equivalent to 5 Analyst Working Days) | If you require additional insights beyond the current scope, our analysts can customize the report to meet your specific business needs. |
The Recycled Polyolefin market report provides detailed insights into market size, share, and growth trends for 2025, along with a comprehensive forecast outlook through 2035. The study combines historical analysis with future projections to deliver a complete market perspective. To request a sample PDF or obtain further information, contact our analyst team at sales@quintilereports.com.
The global recycled polyolefin market is expected to grow at a CAGR of 10.43% from 2026 to 2036, driven by rising demand for sustainable materials and regulatory pressure.
Recycled polyolefins include materials such as recycled polyethylene (rPE) and recycled polypropylene (rPP), derived from post-consumer and industrial plastic waste. They play a critical role in reducing plastic pollution and supporting circular economy initiatives.
Major industries include packaging, automotive, construction, consumer goods, and agriculture, with packaging being the dominant segment.
Growth is driven by strict plastic regulations, increasing sustainability awareness, advancements in recycling technologies, and rising corporate ESG commitments.
Key challenges include inconsistent material quality, limited recycling infrastructure in emerging economies, high processing costs, and complex sorting requirements.
Europe leads due to strong regulations, followed by North America, while Asia-Pacific is the fastest-growing region.
The market is expected to grow steadily with advancements in chemical recycling, improved waste management systems, and increased adoption across industries.
Table 1 List of Abbreviation and acronyms
Table 2 List of Sources
Table 3 North America Global Recycled Polyolefin Market, by Segment Analysis, (USD Million) 2017-2035
Table 4 North America Global Recycled Polyolefin Market, by Region, (USD Million) 2017-2035
Table 5 U.S. Global Recycled Polyolefin Market, by Segment Analysis, (USD Million) 2017-2035
Table 6 Canada Global Recycled Polyolefin Market, by Segment Analysis, (USD Million) 2017-2035
Table 7 Europe Global Recycled Polyolefin Market, by Segment Analysis, (USD Million) 2017-2035
Table 8 Europe Global Recycled Polyolefin Market, by Region, (USD Million) 2017-2035
Table 9 Germany Global Recycled Polyolefin Market, by Segment Analysis, (USD Million) 2017-2035
Table 10 U.K. Global Recycled Polyolefin Market, by Segment Analysis, (USD Million) 2017-2035
Table 11 France Global Recycled Polyolefin Market, by Segment Analysis, (USD Million) 2017-2035
Table 12 Italy Global Recycled Polyolefin Market, by Segment Analysis, (USD Million) 2017-2035
Table 13 Spain Global Recycled Polyolefin Market, by Segment Analysis, (USD Million) 2017-2035
Table 14 Sweden Global Recycled Polyolefin Market, by Segment Analysis, (USD Million) 2017-2035
Table 15 Denmark Global Recycled Polyolefin Market, by Segment Analysis, (USD Million) 2017-2035
Table 16 Norway Global Recycled Polyolefin Market, by Segment Analysis, (USD Million) 2017-2035
Table 17 The Netherlands Global Recycled Polyolefin Market, by Segment Analysis, (USD Million) 2017-2035
Table 18 Russia Global Recycled Polyolefin Market, by Segment Analysis, (USD Million) 2017-2035
Table 19 Asia Pacific Global Recycled Polyolefin Market, by Segment Analysis, (USD Million) 2017-2035
Table 20 Asia Pacific Global Recycled Polyolefin Market, by Region, (USD Million) 2017-2035
Table 21 China Global Recycled Polyolefin Market, by Segment Analysis, (USD Million) 2017-2035
Table 22 Japan Global Recycled Polyolefin Market, by Segment Analysis, (USD Million) 2017-2035
Table 23 India Global Recycled Polyolefin Market, by Segment Analysis, (USD Million) 2017-2035
Table 24 Australia Global Recycled Polyolefin Market, by Segment Analysis, (USD Million) 2017-2035
Table 25 South Korea Global Recycled Polyolefin Market, by Segment Analysis, (USD Million) 2017-2035
Table 26 Thailand Global Recycled Polyolefin Market, by Segment Analysis, (USD Million) 2017-2035
Table 27 Latin America Global Recycled Polyolefin Market, by Segment Analysis, (USD Million) 2017-2035
Table 28 Latin America Global Recycled Polyolefin Market, by Region, (USD Million) 2017-2035
Table 29 Brazil Global Recycled Polyolefin Market, by Segment Analysis, (USD Million) 2017-2035
Table 30 Mexico Global Recycled Polyolefin Market, by Segment Analysis, (USD Million) 2017-2035
Table 31 Argentina Global Recycled Polyolefin Market, by Segment Analysis, (USD Million) 2017-2035
Table 32 Middle East and Africa Global Recycled Polyolefin Market, by Segment Analysis, (USD Million) 2017-2035
Table 33 Middle East and Africa Global Recycled Polyolefin Market, by Region, (USD Million) 2017-2035
Table 34 South Africa Global Recycled Polyolefin Market, by Segment Analysis, (USD Million) 2017-2035
Table 35 Saudi Arabia Global Recycled Polyolefin Market, by Segment Analysis, (USD Million) 2017-2035
Table 36 UAE Global Recycled Polyolefin Market, by Segment Analysis, (USD Million) 2017-2035
Table 37 Kuwait Global Recycled Polyolefin Market, by Segment Analysis, (USD Million) 2017-2035
Table 38 Turkey Global Recycled Polyolefin Market, by Segment Analysis, (USD Million) 2017-2035
Fig.1 Market research process
Fig.2 Market research approaches
Fig.3 Global Recycled Polyolefin Market: market scenario
Fig.4 Global Recycled Polyolefin Market competitive outlook
Fig.5 Global Recycled Polyolefin Market driver analysis
Fig.6 Global Recycled Polyolefin Market restraint analysis
Fig.7 Global Recycled Polyolefin Market opportunity analysis
Fig.8 Global Recycled Polyolefin Market trends analysis
Fig.9 Global Recycled Polyolefin Market: Segment Analysis (Based on the scope)
Fig.10 Global Recycled Polyolefin Market: regional analysis
Fig.11 Global market shares and leading market players
Fig.12 North America market share and leading players
Fig.13 Europe market share and leading players
Fig.14 Asia Pacific market share and leading players
Fig.15 Latin America market share and leading players
Fig.16 Middle East & Africa market share and leading players
Fig.17 North America, by country
Fig.18 North America
Fig.19 North America market estimates and forecast, 2017-2035
Fig.20 U.S.
Fig.21 Canada
Fig.22 Europe
Fig.23 Europe market estimates and forecast, 2017-2035
Fig.24 U.K.
Fig.25 Germany
Fig.26 France
Fig.27 Italy
Fig.28 Spain
Fig.29 Sweden
Fig.30 Denmark
Fig.31 Norway
Fig.32 The Netherlands
Fig.33 Russia
Fig.34 Asia Pacific
Fig.35 Asia Pacific market estimates and forecast, 2017-2035
Fig.36 China
Fig.37 Japan
Fig.38 India
Fig.39 Australia
Fig.40 South Korea
Fig.41 Thailand
Fig.42 Latin America
Fig.43 Latin America market estimates and forecast, 2017-2035
Fig.44 Brazil
Fig.45 Mexico
Fig.46 Argentina
Fig.47 Colombia
Fig.48 Middle East and Africa
Fig.49 Middle East and Africa market estimates and forecast, 2017-2035
Fig.50 Saudi Arabia
Fig.51 South Africa
Fig.52 UAE
Fig.53 Kuwait
Fig.54 Turkey

A license granted to one user. Rules or conditions might be applied for e.g. the use of electric files (PDFs) or printings, depending on product.
A license granted to multiple users.
A license granted to a single business site/establishment.
A license granted to all employees within organisation access to the product.
Immediate / Within 24-48 hours - Working days
Online Payments with PayPal and CCavenue
You can order a report by picking any of the payment methods which is bank wire or online payment through any Debit/Credit card or PayPal.
Hard Copy
 U.S. : +91-626-560-6898