The Global Live Fish Carrier Market was valued at USD 3702.32 million in 2025 and is projected to reach USD 5972.5 million by 2035, advancing at a notable CAGR of 5.79% throughout the forecast period from 2026 to 2035. The Live Fish Carrier market report provides an in-depth analysis of the industry by examining macroeconomic indicators, technological progress, regulatory environments, and evolving consumer trends to highlight the market’s long-term growth outlook.
The live fish carrier market includes vessels designed for the transportation of live fish, primarily for aquaculture and commercial seafood industries. These carriers are equipped with controlled tanks, oxygenation systems, water circulation equipment, and environmental monitoring tools to maintain water quality and fish health during transit. They are used to transport fish from hatcheries to grow-out farms, between aquaculture sites, and from farms to processing facilities or markets.
Taking 2025 as the base year, the Live Fish Carrier market is demonstrating steady growth fueled by increased innovation, expanding application areas across end-use sectors, and rapid digital transformation. Market participants are increasingly optimizing their go-to-market (GTM) strategies to strengthen market penetration and capitalize on emerging business opportunities.
Over the coming decade, the market is expected to maintain strong expansion supported by continuous R&D investments, collaborative partnerships, and a rising number of mergers and acquisitions. Businesses that focus on innovation, operational agility, and customer-focused strategies are expected to build a sustainable competitive advantage. The report delivers comprehensive insights into market drivers, restraints, opportunities, and challenges across segments, regions, and countries, backed by detailed qualitative and quantitative analysis from 2017 to 2035.

As the global demand for farmed fish increases, live fish carriers are becoming essential in maintaining supply chain integrity, reducing fish mortality, and ensuring welfare standards during transport. These vessels help producers meet growing regulatory and consumer expectations for animal welfare and product quality, especially in high-value species such as salmon, trout, and sea bass.
The growing aquaculture industry is closely linked with the rising demand for value-added marine products such as fish oil products. Efficient live fish transport plays an important role in preserving the quality of harvested fish before processing into oils, supplements, and nutritional ingredients. By ensuring fish arrive at processing facilities in optimal condition, live fish carriers support higher-quality raw materials for fish oil extraction and other seafood processing applications.
Infrastructure used in aquaculture production also influences the demand for reliable transport systems. Modern farms rely heavily on durable fishing nets and aquaculture cages to safely grow species such as salmon, sea bass, and trout in offshore or coastal environments. As these cage-based farms expand into deeper waters and remote locations, live fish carriers become essential for transferring fish between cages, hatcheries, and harvesting facilities.
The expansion of offshore aquaculture is also stimulating the fishing nets and aquaculture cages sales market, as producers invest in stronger containment systems capable of withstanding harsh marine conditions. Increased cage installations lead to higher operational activity across aquaculture sites, which in turn raises the need for efficient live fish transport vessels to maintain smooth farm-to-processing logistics.
The unprecedented growth in global aquaculture production directly drives the demand for live fish carriers. Efficient and safe live transport is critical to support this growing output, especially in offshore and cold-water farming regions where distances between sites are large.
Improved fish welfare regulations are encouraging investment in advanced carrier systems. Many countries now require oxygen monitoring, CO₂ removal, temperature control, and low-stress handling techniques during live fish transport. Live fish carriers with onboard water quality systems and compartmentalized tanks help meet these standards and reduce mortality.
Technological advancements in vessel design and automation are also boosting demand. Carriers now include features like automated cleaning systems, remote monitoring, and waste management tools to improve hygiene and reduce labour costs. These improvements increase operational reliability and allow for longer-range, higher-capacity trips.
Export-oriented aquaculture businesses are also investing in live fish carriers. For high-value fish species that must be delivered alive or in optimal condition, these vessels allow direct, rapid, and condition-controlled delivery to international buyers. This ensures higher quality and better pricing, especially in premium seafood markets.
High capital costs remain a major barrier. Live fish carriers are specialized vessels that require advanced onboard technology, durable materials, and custom designs tailored to fish species and transport routes. For small and mid-sized aquaculture firms, such investment is often unaffordable without government support or cooperative funding models.
Maintaining water quality during long voyages is technically complex. Operators must continuously monitor oxygen, ammonia, carbon dioxide, and temperature to prevent stress and disease. Failure to manage these parameters can result in fish mortality, economic losses, and reputational damage.
Limited infrastructure in some regions restricts docking and servicing options for large live fish carriers. Remote farming areas may lack appropriate ports or support services, making vessel operation difficult or inefficient. This is especially relevant in developing countries or island-based aquaculture zones.
Biosecurity risks are also a concern. Transporting live fish between sites may spread pathogens or parasites. Strict cleaning, disinfection, and disease monitoring protocols are required, adding to operational complexity and regulatory burden.
In North America, live fish carriers support the salmon and trout industries, particularly in Canada and Alaska. Growth is supported by improved welfare regulations and increasing investment in recirculating aquaculture systems. The region’s cold-water aquaculture farms require long-range transport, making advanced carriers essential.
Europe has a mature market for live fish carriers, especially in Norway, Scotland, and Iceland. Regulations under the EU's animal welfare standards and aquaculture policies drive demand for high-specification vessels. Growing salmon exports to Asia and North America encourage investment in larger, more efficient carriers.
Asia Pacific sees high demand from countries like Japan, South Korea, and China. Japan uses live fish carriers for high-value species such as yellowtail and sea bream. Coastal aquaculture expansion and export-driven production in South Korea and China support steady growth. Government funding and smart fishing port development further aid market expansion.
Chile is the dominant user of live fish carriers in Latin America, serving its large salmon industry. Export growth, stricter biosecurity rules, and longer farm-to-processing distances support market development. Brazil and Peru are also exploring live fish transport to improve inland aquaculture logistics.
Live fish carrier use is limited but emerging in high-value aquaculture sectors. The UAE and Saudi Arabia use these vessels in offshore fish farming zones, supported by food security goals. In Africa, some coastal nations are testing small-scale systems for tilapia and catfish transport, backed by development programs and fisheries funding.
The United States is gradually expanding offshore and coastal aquaculture, which increases the need for safe and efficient live fish transport. Live fish carriers are used to connect hatcheries, sea cages, and harvest points, especially in colder states like Maine and Alaska. These vessels help meet biosecurity and welfare standards while reducing stress on fish during transfer.
Support from (National Oceanic and Atmospheric Administration) NOAA and the U.S. Department of Agriculture for sustainable seafood development encourages investment in transport infrastructure, including specialized vessels. New market interest in live or fresh seafood delivery is also pushing demand for reliable fish carriers along the east and west coasts.
Germany is investing in domestic aquaculture and seafood transport solutions to reduce reliance on imports. Live fish carriers are used for inland transport between hatcheries, grow-out tanks, and research stations, especially for trout, pike, and carp species. The market is also shaped by consumer demand for traceable and animal-friendly supply chains.
Regulatory focus on animal transport quality and biosecurity under EU law encourages the use of carriers with oxygen and temperature control. German ports are also part of the European logistics chain for high-value imported fish, where live fish carriers are occasionally used to deliver niche species for local markets or specialty restaurants.
Japan’s seafood market places strong emphasis on freshness and presentation. Live fish carriers are widely used to transport yellowtail, sea bream, and pufferfish between coastal farms, wholesale markets, and sushi-grade buyers. Vessels are equipped with carefully monitored tanks to reduce stress and maintain fish vitality.
Support from the Ministry of Agriculture, Forestry and Fisheries encourages modern aquaculture transport systems. Japan’s tight logistics timelines, cultural preference for live seafood, and proximity to urban markets make the use of efficient live fish carriers a critical part of the country’s seafood distribution network.
The live fish carrier market includes shipbuilders, aquaculture equipment manufacturers, and service providers offering vessel operation and maintenance. Leading companies offer custom-built carriers with high-capacity tanks, oxygenation systems, and real-time monitoring platforms tailored to regional conditions and fish species.
European shipyards dominate vessel construction for salmon farming, producing large, steel-hulled ships with integrated control systems. These firms serve clients in Norway, Chile, and Canada, offering both new builds and retrofitting services. Their focus on hygiene, automation, and environmental compliance gives them a competitive advantage.
Asian companies, particularly in Japan and South Korea, build smaller, agile carriers suited to coastal transport. These vessels focus on premium fish transport with features like vibration reduction and real-time water analysis. Their design expertise and integration with local ports support their strong regional presence.
Some firms offer end-to-end services, including vessel leasing, staffing, and biosecurity compliance. This appeals to farms that do not want to manage their own carrier fleets. These service providers often work under contract with seafood processors or cooperatives to optimize delivery schedules and reduce capital costs.
Innovation is growing in sensor technology, onboard filtration, and hybrid propulsion. Firms that invest in clean transport, digital tracking, and AI-based water quality management are gaining attention from regulators and large aquaculture firms seeking efficiency and sustainability.
Key players in the market are Havyard Group, Aas Mek. Verksted, Damen Shipyards Group, Rostein AS, Fiskerstrand Verft AS, Solstrand Trading, Myklebust Verft AS, Marine Harvest, MacGregor (Cargotec), Moen Marin, Norwegian Electric Systems, DNV (Det Norske Veritas), AKVA Group, and other players.

Our team of experienced researchers has meticulously gathered and analyzed data to deliver a thorough examination of market dynamics, competitive landscape, and emerging technologies. With a focus on delivering actionable intelligence, this report aims to empower decision-makers with the information needed to make informed choices and stay ahead of the competition. Whether you are a seasoned industry player or a new entrant, our market research report serves as a strategic tool to navigate the complexities of the market, aiding in successful business planning and growth strategies.
This chapter of our Live Fish Carrier market report provides an in-depth examination of the factors shaping the industry landscape. This section typically encompasses several key elements to offer a comprehensive understanding of the industry landscape such as market drivers & restraints analysis, market opportunities & trend analysis, market size & growth analysis, competitive analysis, SWOT analysis, business environment tools such as Porter's five forces & PESTEL analysis, Ansoff Matrix analysis, penetration & growth prospect analysis, regulatory framework & reimbursement scenario analysis, impact of macro & micro economic factors analysis such as Covid-19 impact, GDP growth, market inflation, U.S.- China trade war, Russia-Ukraine war impact, and supply chain analysis.
The segment analysis chapter of Live Fish Carrier market report is a critical section that delves into a detailed examination of the market's various segments. Segmentation involves dividing the market into distinct categories based on certain criteria to better understand and address the diverse needs of consumers. This chapter typically follows the introduction and provides a more granular view of the market, offering valuable insights for businesses and stakeholders. The components of the chapter include segment definitions to understand the inclusions and exclusions of the study, assumptions, market size estimates and growth trend analysis of each segment, qualitative analysis of the segment, technological advancements, market penetration rate, market adoption rate, market share examination by each segment, segment growth drivers and restraint barriers, consumer behaviour and challenge analysis.
The chapter in Live Fish Carrier market research report is a pivotal section that examines and predicts the market dynamics and trends specific to different geographical regions. This chapter is crucial for businesses and stakeholders seeking a comprehensive understanding of how the market behaves across various locations, enabling them to tailor strategies and make informed decisions based on regional variations. The regional analysis chapter of our Live Fish Carrier market report is classified into regions & country-level. The chapter consists of North America (U.S., Canada), Europe (UK, Germany, France, Italy, Spain, Russia, Sweden, Denmark, Norway, Rest of Europe), Asia Pacific (Japan, China, India, Australia, South Korea, Thailand, Rest of Asia Pacific), Latin America (Brazil, Mexico, Argentina, Colombia, Rest of Latin America), Middle East & Africa (South Africa, Saudi Arabia, UAE, Kuwait, Rest of Middle East & Africa).

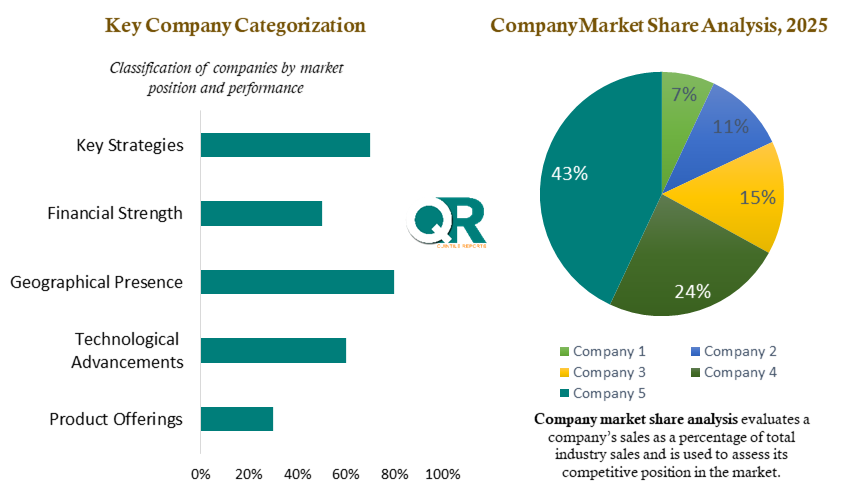
This section of a Live Fish Carrier market report is a crucial segment that provides a comprehensive overview of the competitive landscape within the market. This section is vital for businesses, investors, and stakeholders seeking insights into key players, their market positioning, strengths, weaknesses, strategies, and potential impacts on the overall market dynamics. The chapter includes research methodology used to analyse the market competition, list of key players operating in the market, detailed company profile section which includes company overview, business verticals, financial performance, product/services benchmarking, geographical presence, and strategic initiatives.
| Report Scope | Details |
| Report Version | 2026 |
| Growth Rate | CAGR of 5.79 from 2026 to 2035 |
| Base Year | 2025 |
| Actual Estimates / Historical Data | 2017 - 2024 |
| Forecast Period | 2026 - 2035 |
| Quantitative Units | Revenue in USD million/billion & CAGR from 2026 to 2035 |
| Country Scope | North America (U.S., Canada), Europe (UK, Germany, France, Italy, Spain, Russia, Sweden, Denmark, Norway, Rest of Europe), Asia Pacific (Japan, China, India, Australia, South Korea, Thailand, Rest of Asia Pacific), Latin America (Brazil, Mexico, Argentina, Colombia, Rest of Latin America), Middle East & Africa (South Africa, Saudi Arabia, UAE, Kuwait, Rest of Middle East & Africa). |
| The Segment Covered by Carrier Type |
|
| The Segment Covered by Length |
|
| Companies Covered |
|
| Report Coverage | Revenue forecast, company share, competitive landscape, growth factors, and trends |
| Free Customization Scope (Equivalent to 5 Analyst Working Days) | If you need specific information, which is not currently within the scope of the report, we will provide it to you as a part of the customization |

Statistics for the 2025 Live Fish Carrier market share, size, and revenue growth rate were created by Quintile Report™. Live Fish Carrier analysis includes a market forecast outlook for 2035 and a historical overview. Get a free PDF sample of this market analysis, please get in touch with our principal analyst at sales@quintilereports.com
List of Tables
Table 1 List of Abbreviation and acronyms
Table 2 List of Sources
Table 3 North America Global Live Fish Carrier Market, by Segment Analysis, (USD Million) 2017-2035
Table 4 North America Global Live Fish Carrier Market, by Region, (USD Million) 2017-2035
Table 5 U.S. Global Live Fish Carrier Market, by Segment Analysis, (USD Million) 2017-2035
Table 6 Canada Global Live Fish Carrier Market, by Segment Analysis, (USD Million) 2017-2035
Table 7 Europe Global Live Fish Carrier Market, by Segment Analysis, (USD Million) 2017-2035
Table 8 Europe Global Live Fish Carrier Market, by Region, (USD Million) 2017-2035
Table 9 Germany Global Live Fish Carrier Market, by Segment Analysis, (USD Million) 2017-2035
Table 10 U.K. Global Live Fish Carrier Market, by Segment Analysis, (USD Million) 2017-2035
Table 11 France Global Live Fish Carrier Market, by Segment Analysis, (USD Million) 2017-2035
Table 12 Italy Global Live Fish Carrier Market, by Segment Analysis, (USD Million) 2017-2035
Table 13 Spain Global Live Fish Carrier Market, by Segment Analysis, (USD Million) 2017-2035
Table 14 Sweden Global Live Fish Carrier Market, by Segment Analysis, (USD Million) 2017-2035
Table 15 Denmark Global Live Fish Carrier Market, by Segment Analysis, (USD Million) 2017-2035
Table 16 Norway Global Live Fish Carrier Market, by Segment Analysis, (USD Million) 2017-2035
Table 17 The Netherlands Global Live Fish Carrier Market, by Segment Analysis, (USD Million) 2017-2035
Table 18 Russia Global Live Fish Carrier Market, by Segment Analysis, (USD Million) 2017-2035
Table 19 Asia Pacific Global Live Fish Carrier Market, by Segment Analysis, (USD Million) 2017-2035
Table 20 Asia Pacific Global Live Fish Carrier Market, by Region, (USD Million) 2017-2035
Table 21 China Global Live Fish Carrier Market, by Segment Analysis, (USD Million) 2017-2035
Table 22 Japan Global Live Fish Carrier Market, by Segment Analysis, (USD Million) 2017-2035
Table 23 India Global Live Fish Carrier Market, by Segment Analysis, (USD Million) 2017-2035
Table 24 Australia Global Live Fish Carrier Market, by Segment Analysis, (USD Million) 2017-2035
Table 25 South Korea Global Live Fish Carrier Market, by Segment Analysis, (USD Million) 2017-2035
Table 26 Thailand Global Live Fish Carrier Market, by Segment Analysis, (USD Million) 2017-2035
Table 27 Latin America Global Live Fish Carrier Market, by Segment Analysis, (USD Million) 2017-2035
Table 28 Latin America Global Live Fish Carrier Market, by Region, (USD Million) 2017-2035
Table 29 Brazil Global Live Fish Carrier Market, by Segment Analysis, (USD Million) 2017-2035
Table 30 Mexico Global Live Fish Carrier Market, by Segment Analysis, (USD Million) 2017-2035
Table 31 Argentina Global Live Fish Carrier Market, by Segment Analysis, (USD Million) 2017-2035
Table 32 Middle East and Africa Global Live Fish Carrier Market, by Segment Analysis, (USD Million) 2017-2035
Table 33 Middle East and Africa Global Live Fish Carrier Market, by Region, (USD Million) 2017-2035
Table 34 South Africa Global Live Fish Carrier Market, by Segment Analysis, (USD Million) 2017-2035
Table 35 Saudi Arabia Global Live Fish Carrier Market, by Segment Analysis, (USD Million) 2017-2035
Table 36 UAE Global Live Fish Carrier Market, by Segment Analysis, (USD Million) 2017-2035
Table 37 Kuwait Global Live Fish Carrier Market, by Segment Analysis, (USD Million) 2017-2035
Table 38 Turkey Global Live Fish Carrier Market, by Segment Analysis, (USD Million) 2017-2035
Fig.1 Market research process
Fig.2 Market research approaches
Fig.3 Global Live Fish Carrier Market: market scenario
Fig.4 Global Live Fish Carrier Market competitive outlook
Fig.5 Global Live Fish Carrier Market driver analysis
Fig.6 Global Live Fish Carrier Market restraint analysis
Fig.7 Global Live Fish Carrier Market opportunity analysis
Fig.8 Global Live Fish Carrier Market trends analysis
Fig.9 Global Live Fish Carrier Market: Segment Analysis (Based on the scope)
Fig.10 Global Live Fish Carrier Market: regional analysis
Fig.11 Global market shares and leading market players
Fig.12 North America market share and leading players
Fig.13 Europe market share and leading players
Fig.14 Asia Pacific market share and leading players
Fig.15 Latin America market share and leading players
Fig.16 Middle East & Africa market share and leading players
Fig.17 North America, by country
Fig.18 North America
Fig.19 North America market estimates and forecast, 2017-2035
Fig.20 U.S.
Fig.21 Canada
Fig.22 Europe
Fig.23 Europe market estimates and forecast, 2017-2035
Fig.24 U.K.
Fig.25 Germany
Fig.26 France
Fig.27 Italy
Fig.28 Spain
Fig.29 Sweden
Fig.30 Denmark
Fig.31 Norway
Fig.32 The Netherlands
Fig.33 Russia
Fig.34 Asia Pacific
Fig.35 Asia Pacific market estimates and forecast, 2017-2035
Fig.36 China
Fig.37 Japan
Fig.38 India
Fig.39 Australia
Fig.40 South Korea
Fig.41 Thailand
Fig.42 Latin America
Fig.43 Latin America market estimates and forecast, 2017-2035
Fig.44 Brazil
Fig.45 Mexico
Fig.46 Argentina
Fig.47 Colombia
Fig.48 Middle East and Africa
Fig.49 Middle East and Africa market estimates and forecast, 2017-2035
Fig.50 Saudi Arabia
Fig.51 South Africa
Fig.52 UAE
Fig.53 Kuwait
Fig.54 Turkey
The Global Live Fish Carrier Market was valued at USD 3702.32 million in 2025 and is projected to reach USD 5972.5 million by 2035, advancing at a notable CAGR of 5.79% throughout the forecast period from 2026 to 2035. The Live Fish Carrier market report provides an in-depth analysis of the industry by examining macroeconomic indicators, technological progress, regulatory environments, and evolving consumer trends to highlight the market’s long-term growth outlook.
The live fish carrier market includes vessels designed for the transportation of live fish, primarily for aquaculture and commercial seafood industries. These carriers are equipped with controlled tanks, oxygenation systems, water circulation equipment, and environmental monitoring tools to maintain water quality and fish health during transit. They are used to transport fish from hatcheries to grow-out farms, between aquaculture sites, and from farms to processing facilities or markets.
Taking 2025 as the base year, the Live Fish Carrier market is demonstrating steady growth fueled by increased innovation, expanding application areas across end-use sectors, and rapid digital transformation. Market participants are increasingly optimizing their go-to-market (GTM) strategies to strengthen market penetration and capitalize on emerging business opportunities.
Over the coming decade, the market is expected to maintain strong expansion supported by continuous R&D investments, collaborative partnerships, and a rising number of mergers and acquisitions. Businesses that focus on innovation, operational agility, and customer-focused strategies are expected to build a sustainable competitive advantage. The report delivers comprehensive insights into market drivers, restraints, opportunities, and challenges across segments, regions, and countries, backed by detailed qualitative and quantitative analysis from 2017 to 2035.
As the global demand for farmed fish increases, live fish carriers are becoming essential in maintaining supply chain integrity, reducing fish mortality, and ensuring welfare standards during transport. These vessels help producers meet growing regulatory and consumer expectations for animal welfare and product quality, especially in high-value species such as salmon, trout, and sea bass.
The growing aquaculture industry is closely linked with the rising demand for value-added marine products such as fish oil products. Efficient live fish transport plays an important role in preserving the quality of harvested fish before processing into oils, supplements, and nutritional ingredients. By ensuring fish arrive at processing facilities in optimal condition, live fish carriers support higher-quality raw materials for fish oil extraction and other seafood processing applications.
Infrastructure used in aquaculture production also influences the demand for reliable transport systems. Modern farms rely heavily on durable fishing nets and aquaculture cages to safely grow species such as salmon, sea bass, and trout in offshore or coastal environments. As these cage-based farms expand into deeper waters and remote locations, live fish carriers become essential for transferring fish between cages, hatcheries, and harvesting facilities.
The expansion of offshore aquaculture is also stimulating the fishing nets and aquaculture cages sales market, as producers invest in stronger containment systems capable of withstanding harsh marine conditions. Increased cage installations lead to higher operational activity across aquaculture sites, which in turn raises the need for efficient live fish transport vessels to maintain smooth farm-to-processing logistics.
The unprecedented growth in global aquaculture production directly drives the demand for live fish carriers. Efficient and safe live transport is critical to support this growing output, especially in offshore and cold-water farming regions where distances between sites are large.
Improved fish welfare regulations are encouraging investment in advanced carrier systems. Many countries now require oxygen monitoring, CO₂ removal, temperature control, and low-stress handling techniques during live fish transport. Live fish carriers with onboard water quality systems and compartmentalized tanks help meet these standards and reduce mortality.
Technological advancements in vessel design and automation are also boosting demand. Carriers now include features like automated cleaning systems, remote monitoring, and waste management tools to improve hygiene and reduce labour costs. These improvements increase operational reliability and allow for longer-range, higher-capacity trips.
Export-oriented aquaculture businesses are also investing in live fish carriers. For high-value fish species that must be delivered alive or in optimal condition, these vessels allow direct, rapid, and condition-controlled delivery to international buyers. This ensures higher quality and better pricing, especially in premium seafood markets.
High capital costs remain a major barrier. Live fish carriers are specialized vessels that require advanced onboard technology, durable materials, and custom designs tailored to fish species and transport routes. For small and mid-sized aquaculture firms, such investment is often unaffordable without government support or cooperative funding models.
Maintaining water quality during long voyages is technically complex. Operators must continuously monitor oxygen, ammonia, carbon dioxide, and temperature to prevent stress and disease. Failure to manage these parameters can result in fish mortality, economic losses, and reputational damage.
Limited infrastructure in some regions restricts docking and servicing options for large live fish carriers. Remote farming areas may lack appropriate ports or support services, making vessel operation difficult or inefficient. This is especially relevant in developing countries or island-based aquaculture zones.
Biosecurity risks are also a concern. Transporting live fish between sites may spread pathogens or parasites. Strict cleaning, disinfection, and disease monitoring protocols are required, adding to operational complexity and regulatory burden.
In North America, live fish carriers support the salmon and trout industries, particularly in Canada and Alaska. Growth is supported by improved welfare regulations and increasing investment in recirculating aquaculture systems. The region’s cold-water aquaculture farms require long-range transport, making advanced carriers essential.
Europe has a mature market for live fish carriers, especially in Norway, Scotland, and Iceland. Regulations under the EU's animal welfare standards and aquaculture policies drive demand for high-specification vessels. Growing salmon exports to Asia and North America encourage investment in larger, more efficient carriers.
Asia Pacific sees high demand from countries like Japan, South Korea, and China. Japan uses live fish carriers for high-value species such as yellowtail and sea bream. Coastal aquaculture expansion and export-driven production in South Korea and China support steady growth. Government funding and smart fishing port development further aid market expansion.
Chile is the dominant user of live fish carriers in Latin America, serving its large salmon industry. Export growth, stricter biosecurity rules, and longer farm-to-processing distances support market development. Brazil and Peru are also exploring live fish transport to improve inland aquaculture logistics.
Live fish carrier use is limited but emerging in high-value aquaculture sectors. The UAE and Saudi Arabia use these vessels in offshore fish farming zones, supported by food security goals. In Africa, some coastal nations are testing small-scale systems for tilapia and catfish transport, backed by development programs and fisheries funding.
The United States is gradually expanding offshore and coastal aquaculture, which increases the need for safe and efficient live fish transport. Live fish carriers are used to connect hatcheries, sea cages, and harvest points, especially in colder states like Maine and Alaska. These vessels help meet biosecurity and welfare standards while reducing stress on fish during transfer.
Support from (National Oceanic and Atmospheric Administration) NOAA and the U.S. Department of Agriculture for sustainable seafood development encourages investment in transport infrastructure, including specialized vessels. New market interest in live or fresh seafood delivery is also pushing demand for reliable fish carriers along the east and west coasts.
Germany is investing in domestic aquaculture and seafood transport solutions to reduce reliance on imports. Live fish carriers are used for inland transport between hatcheries, grow-out tanks, and research stations, especially for trout, pike, and carp species. The market is also shaped by consumer demand for traceable and animal-friendly supply chains.
Regulatory focus on animal transport quality and biosecurity under EU law encourages the use of carriers with oxygen and temperature control. German ports are also part of the European logistics chain for high-value imported fish, where live fish carriers are occasionally used to deliver niche species for local markets or specialty restaurants.
Japan’s seafood market places strong emphasis on freshness and presentation. Live fish carriers are widely used to transport yellowtail, sea bream, and pufferfish between coastal farms, wholesale markets, and sushi-grade buyers. Vessels are equipped with carefully monitored tanks to reduce stress and maintain fish vitality.
Support from the Ministry of Agriculture, Forestry and Fisheries encourages modern aquaculture transport systems. Japan’s tight logistics timelines, cultural preference for live seafood, and proximity to urban markets make the use of efficient live fish carriers a critical part of the country’s seafood distribution network.
The live fish carrier market includes shipbuilders, aquaculture equipment manufacturers, and service providers offering vessel operation and maintenance. Leading companies offer custom-built carriers with high-capacity tanks, oxygenation systems, and real-time monitoring platforms tailored to regional conditions and fish species.
European shipyards dominate vessel construction for salmon farming, producing large, steel-hulled ships with integrated control systems. These firms serve clients in Norway, Chile, and Canada, offering both new builds and retrofitting services. Their focus on hygiene, automation, and environmental compliance gives them a competitive advantage.
Asian companies, particularly in Japan and South Korea, build smaller, agile carriers suited to coastal transport. These vessels focus on premium fish transport with features like vibration reduction and real-time water analysis. Their design expertise and integration with local ports support their strong regional presence.
Some firms offer end-to-end services, including vessel leasing, staffing, and biosecurity compliance. This appeals to farms that do not want to manage their own carrier fleets. These service providers often work under contract with seafood processors or cooperatives to optimize delivery schedules and reduce capital costs.
Innovation is growing in sensor technology, onboard filtration, and hybrid propulsion. Firms that invest in clean transport, digital tracking, and AI-based water quality management are gaining attention from regulators and large aquaculture firms seeking efficiency and sustainability.
Key players in the market are Havyard Group, Aas Mek. Verksted, Damen Shipyards Group, Rostein AS, Fiskerstrand Verft AS, Solstrand Trading, Myklebust Verft AS, Marine Harvest, MacGregor (Cargotec), Moen Marin, Norwegian Electric Systems, DNV (Det Norske Veritas), AKVA Group, and other players.
Our team of experienced researchers has meticulously gathered and analyzed data to deliver a thorough examination of market dynamics, competitive landscape, and emerging technologies. With a focus on delivering actionable intelligence, this report aims to empower decision-makers with the information needed to make informed choices and stay ahead of the competition. Whether you are a seasoned industry player or a new entrant, our market research report serves as a strategic tool to navigate the complexities of the market, aiding in successful business planning and growth strategies.
This chapter of our Live Fish Carrier market report provides an in-depth examination of the factors shaping the industry landscape. This section typically encompasses several key elements to offer a comprehensive understanding of the industry landscape such as market drivers & restraints analysis, market opportunities & trend analysis, market size & growth analysis, competitive analysis, SWOT analysis, business environment tools such as Porter's five forces & PESTEL analysis, Ansoff Matrix analysis, penetration & growth prospect analysis, regulatory framework & reimbursement scenario analysis, impact of macro & micro economic factors analysis such as Covid-19 impact, GDP growth, market inflation, U.S.- China trade war, Russia-Ukraine war impact, and supply chain analysis.
The segment analysis chapter of Live Fish Carrier market report is a critical section that delves into a detailed examination of the market's various segments. Segmentation involves dividing the market into distinct categories based on certain criteria to better understand and address the diverse needs of consumers. This chapter typically follows the introduction and provides a more granular view of the market, offering valuable insights for businesses and stakeholders. The components of the chapter include segment definitions to understand the inclusions and exclusions of the study, assumptions, market size estimates and growth trend analysis of each segment, qualitative analysis of the segment, technological advancements, market penetration rate, market adoption rate, market share examination by each segment, segment growth drivers and restraint barriers, consumer behaviour and challenge analysis.
The chapter in Live Fish Carrier market research report is a pivotal section that examines and predicts the market dynamics and trends specific to different geographical regions. This chapter is crucial for businesses and stakeholders seeking a comprehensive understanding of how the market behaves across various locations, enabling them to tailor strategies and make informed decisions based on regional variations. The regional analysis chapter of our Live Fish Carrier market report is classified into regions & country-level. The chapter consists of North America (U.S., Canada), Europe (UK, Germany, France, Italy, Spain, Russia, Sweden, Denmark, Norway, Rest of Europe), Asia Pacific (Japan, China, India, Australia, South Korea, Thailand, Rest of Asia Pacific), Latin America (Brazil, Mexico, Argentina, Colombia, Rest of Latin America), Middle East & Africa (South Africa, Saudi Arabia, UAE, Kuwait, Rest of Middle East & Africa).
This section of a Live Fish Carrier market report is a crucial segment that provides a comprehensive overview of the competitive landscape within the market. This section is vital for businesses, investors, and stakeholders seeking insights into key players, their market positioning, strengths, weaknesses, strategies, and potential impacts on the overall market dynamics. The chapter includes research methodology used to analyse the market competition, list of key players operating in the market, detailed company profile section which includes company overview, business verticals, financial performance, product/services benchmarking, geographical presence, and strategic initiatives.
| Report Scope | Details |
| Report Version | 2026 |
| Growth Rate | CAGR of 5.79 from 2026 to 2035 |
| Base Year | 2025 |
| Actual Estimates / Historical Data | 2017 - 2024 |
| Forecast Period | 2026 - 2035 |
| Quantitative Units | Revenue in USD million/billion & CAGR from 2026 to 2035 |
| Country Scope | North America (U.S., Canada), Europe (UK, Germany, France, Italy, Spain, Russia, Sweden, Denmark, Norway, Rest of Europe), Asia Pacific (Japan, China, India, Australia, South Korea, Thailand, Rest of Asia Pacific), Latin America (Brazil, Mexico, Argentina, Colombia, Rest of Latin America), Middle East & Africa (South Africa, Saudi Arabia, UAE, Kuwait, Rest of Middle East & Africa). |
| The Segment Covered by Carrier Type |
|
| The Segment Covered by Length |
|
| Companies Covered |
|
| Report Coverage | Revenue forecast, company share, competitive landscape, growth factors, and trends |
| Free Customization Scope (Equivalent to 5 Analyst Working Days) | If you need specific information, which is not currently within the scope of the report, we will provide it to you as a part of the customization |
Statistics for the 2025 Live Fish Carrier market share, size, and revenue growth rate were created by Quintile Report™. Live Fish Carrier analysis includes a market forecast outlook for 2035 and a historical overview. Get a free PDF sample of this market analysis, please get in touch with our principal analyst at sales@quintilereports.com
Table 1 List of Abbreviation and acronyms
Table 2 List of Sources
Table 3 North America Global Live Fish Carrier Market, by Segment Analysis, (USD Million) 2017-2035
Table 4 North America Global Live Fish Carrier Market, by Region, (USD Million) 2017-2035
Table 5 U.S. Global Live Fish Carrier Market, by Segment Analysis, (USD Million) 2017-2035
Table 6 Canada Global Live Fish Carrier Market, by Segment Analysis, (USD Million) 2017-2035
Table 7 Europe Global Live Fish Carrier Market, by Segment Analysis, (USD Million) 2017-2035
Table 8 Europe Global Live Fish Carrier Market, by Region, (USD Million) 2017-2035
Table 9 Germany Global Live Fish Carrier Market, by Segment Analysis, (USD Million) 2017-2035
Table 10 U.K. Global Live Fish Carrier Market, by Segment Analysis, (USD Million) 2017-2035
Table 11 France Global Live Fish Carrier Market, by Segment Analysis, (USD Million) 2017-2035
Table 12 Italy Global Live Fish Carrier Market, by Segment Analysis, (USD Million) 2017-2035
Table 13 Spain Global Live Fish Carrier Market, by Segment Analysis, (USD Million) 2017-2035
Table 14 Sweden Global Live Fish Carrier Market, by Segment Analysis, (USD Million) 2017-2035
Table 15 Denmark Global Live Fish Carrier Market, by Segment Analysis, (USD Million) 2017-2035
Table 16 Norway Global Live Fish Carrier Market, by Segment Analysis, (USD Million) 2017-2035
Table 17 The Netherlands Global Live Fish Carrier Market, by Segment Analysis, (USD Million) 2017-2035
Table 18 Russia Global Live Fish Carrier Market, by Segment Analysis, (USD Million) 2017-2035
Table 19 Asia Pacific Global Live Fish Carrier Market, by Segment Analysis, (USD Million) 2017-2035
Table 20 Asia Pacific Global Live Fish Carrier Market, by Region, (USD Million) 2017-2035
Table 21 China Global Live Fish Carrier Market, by Segment Analysis, (USD Million) 2017-2035
Table 22 Japan Global Live Fish Carrier Market, by Segment Analysis, (USD Million) 2017-2035
Table 23 India Global Live Fish Carrier Market, by Segment Analysis, (USD Million) 2017-2035
Table 24 Australia Global Live Fish Carrier Market, by Segment Analysis, (USD Million) 2017-2035
Table 25 South Korea Global Live Fish Carrier Market, by Segment Analysis, (USD Million) 2017-2035
Table 26 Thailand Global Live Fish Carrier Market, by Segment Analysis, (USD Million) 2017-2035
Table 27 Latin America Global Live Fish Carrier Market, by Segment Analysis, (USD Million) 2017-2035
Table 28 Latin America Global Live Fish Carrier Market, by Region, (USD Million) 2017-2035
Table 29 Brazil Global Live Fish Carrier Market, by Segment Analysis, (USD Million) 2017-2035
Table 30 Mexico Global Live Fish Carrier Market, by Segment Analysis, (USD Million) 2017-2035
Table 31 Argentina Global Live Fish Carrier Market, by Segment Analysis, (USD Million) 2017-2035
Table 32 Middle East and Africa Global Live Fish Carrier Market, by Segment Analysis, (USD Million) 2017-2035
Table 33 Middle East and Africa Global Live Fish Carrier Market, by Region, (USD Million) 2017-2035
Table 34 South Africa Global Live Fish Carrier Market, by Segment Analysis, (USD Million) 2017-2035
Table 35 Saudi Arabia Global Live Fish Carrier Market, by Segment Analysis, (USD Million) 2017-2035
Table 36 UAE Global Live Fish Carrier Market, by Segment Analysis, (USD Million) 2017-2035
Table 37 Kuwait Global Live Fish Carrier Market, by Segment Analysis, (USD Million) 2017-2035
Table 38 Turkey Global Live Fish Carrier Market, by Segment Analysis, (USD Million) 2017-2035
Fig.1 Market research process
Fig.2 Market research approaches
Fig.3 Global Live Fish Carrier Market: market scenario
Fig.4 Global Live Fish Carrier Market competitive outlook
Fig.5 Global Live Fish Carrier Market driver analysis
Fig.6 Global Live Fish Carrier Market restraint analysis
Fig.7 Global Live Fish Carrier Market opportunity analysis
Fig.8 Global Live Fish Carrier Market trends analysis
Fig.9 Global Live Fish Carrier Market: Segment Analysis (Based on the scope)
Fig.10 Global Live Fish Carrier Market: regional analysis
Fig.11 Global market shares and leading market players
Fig.12 North America market share and leading players
Fig.13 Europe market share and leading players
Fig.14 Asia Pacific market share and leading players
Fig.15 Latin America market share and leading players
Fig.16 Middle East & Africa market share and leading players
Fig.17 North America, by country
Fig.18 North America
Fig.19 North America market estimates and forecast, 2017-2035
Fig.20 U.S.
Fig.21 Canada
Fig.22 Europe
Fig.23 Europe market estimates and forecast, 2017-2035
Fig.24 U.K.
Fig.25 Germany
Fig.26 France
Fig.27 Italy
Fig.28 Spain
Fig.29 Sweden
Fig.30 Denmark
Fig.31 Norway
Fig.32 The Netherlands
Fig.33 Russia
Fig.34 Asia Pacific
Fig.35 Asia Pacific market estimates and forecast, 2017-2035
Fig.36 China
Fig.37 Japan
Fig.38 India
Fig.39 Australia
Fig.40 South Korea
Fig.41 Thailand
Fig.42 Latin America
Fig.43 Latin America market estimates and forecast, 2017-2035
Fig.44 Brazil
Fig.45 Mexico
Fig.46 Argentina
Fig.47 Colombia
Fig.48 Middle East and Africa
Fig.49 Middle East and Africa market estimates and forecast, 2017-2035
Fig.50 Saudi Arabia
Fig.51 South Africa
Fig.52 UAE
Fig.53 Kuwait
Fig.54 Turkey

A license granted to one user. Rules or conditions might be applied for e.g. the use of electric files (PDFs) or printings, depending on product.
A license granted to multiple users.
A license granted to a single business site/establishment.
A license granted to all employees within organisation access to the product.
Immediate / Within 24-48 hours - Working days
Online Payments with PayPal and CCavenue
You can order a report by picking any of the payment methods which is bank wire or online payment through any Debit/Credit card or PayPal.
Hard Copy
 U.S. : +1-201-772-7734