The global Local Anesthesia Drugs Market is poised for steady expansion over the next decade, driven by the growing volume of surgical procedures, increasing adoption of minimally invasive treatments, and rising demand for effective pain management solutions across healthcare settings. Local anesthetic drugs play a critical role in modern medicine by temporarily blocking nerve signals in a targeted area, enabling pain-free diagnostic, therapeutic, and surgical interventions while reducing the risks associated with general anesthesia.
The market is projected to grow from USD 4.28 billion in 2026 to USD 6.36 billion by 2036, registering a compound annual growth rate (CAGR) of 4.05% during the forecast period. The expansion is supported by advancements in anesthetic formulations, increasing outpatient surgical procedures, and the growing prevalence of chronic conditions requiring repeated medical interventions.
Healthcare providers worldwide are increasingly prioritizing patient-centric care models that emphasize faster recovery times, reduced hospital stays, and improved procedural efficiency. Local anesthesia drugs align closely with these objectives by offering targeted pain control, lower systemic complications, and enhanced patient safety profiles. Furthermore, rising healthcare investments across emerging economies and expanding access to surgical services are creating new opportunities for market participants.
Innovation remains a key market driver, with pharmaceutical companies focusing on longer-acting formulations, improved delivery systems, and combination therapies designed to optimize pain management outcomes. As healthcare systems continue to evolve toward cost-effective treatment approaches, local anesthesia drugs are expected to remain an essential component of clinical practice across hospitals, ambulatory surgical centers, dental clinics, and specialty healthcare facilities.

The Local Anesthesia Drugs Market continues to demonstrate resilient growth due to increasing surgical volumes, advancements in pain management technologies, and the rising preference for outpatient procedures. Local anesthetics have become indispensable across a broad range of medical disciplines, including dentistry, orthopedics, dermatology, ophthalmology, and general surgery. Their ability to provide targeted pain relief while minimizing recovery time has strengthened their adoption among healthcare professionals globally.
Market growth is being further supported by aging populations, increasing incidences of chronic diseases, and the growing demand for minimally invasive treatments. Healthcare providers are increasingly leveraging local anesthesia solutions to enhance patient comfort, improve procedural outcomes, and reduce healthcare costs associated with prolonged hospitalization.
Developed regions continue to benefit from advanced healthcare infrastructure and robust surgical volumes, while emerging economies are witnessing accelerated adoption due to healthcare modernization initiatives and expanding access to medical care. Continuous product development, regulatory approvals, and strategic collaborations among pharmaceutical manufacturers are expected to shape the competitive landscape and foster long-term market expansion through 2036.
"
The regional assessment of the Local Anesthesia Drugs Market incorporates a comprehensive evaluation framework designed to capture market dynamics across major geographical regions, including North America, Europe, Asia-Pacific, Latin America, and the Middle East & Africa. The research methodology combines primary and secondary data collection techniques to ensure reliable market intelligence and actionable insights.
Primary research involves interviews with healthcare professionals, anesthesiologists, pharmaceutical executives, procurement specialists, and industry experts to understand current adoption trends, purchasing behaviors, and future growth opportunities. Secondary research includes the analysis of regulatory publications, healthcare databases, company reports, scientific journals, clinical studies, and industry associations.
Regional market estimations are developed by examining factors such as healthcare expenditure, surgical procedure volumes, reimbursement policies, demographic trends, healthcare infrastructure development, and the availability of anesthetic products. Country-level analyses further strengthen the accuracy of market projections by accounting for local regulatory environments, economic conditions, and healthcare accessibility. This multi-layered approach enables a comprehensive understanding of regional growth patterns and emerging opportunities across the global market landscape.

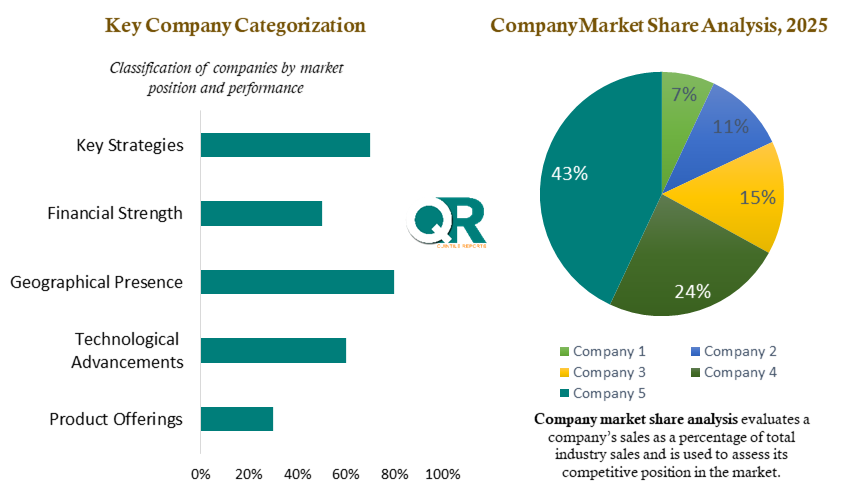
The competitive landscape of the Local Anesthesia Drugs Market is characterized by the presence of established pharmaceutical manufacturers, specialty drug developers, and emerging healthcare innovators. Market participants compete through product innovation, strategic partnerships, geographical expansion, regulatory approvals, and investments in research and development.
Leading companies are increasingly focusing on developing advanced anesthetic formulations with extended duration of action, improved safety profiles, and enhanced patient outcomes. Competitive differentiation is also being achieved through novel drug delivery technologies that improve precision, efficacy, and convenience during medical procedures.
In addition to product development, strategic mergers, acquisitions, licensing agreements, and collaborations with healthcare institutions have become important growth strategies. Companies are actively strengthening their global distribution networks to expand market penetration in both developed and emerging healthcare markets. As regulatory standards continue to evolve, organizations with strong clinical research capabilities and robust compliance frameworks are expected to maintain a competitive advantage.
The competitive environment remains dynamic, with innovation, regulatory expertise, and commercial scalability serving as key determinants of long-term success within the industry.
| Report Scope | Details |
| Report Version | 2026 |
| Growth Rate | CAGR of 4.05 % from 2026 to 2036 |
| Base Year | 2025 |
| Actual Estimates / Historical Data | 2017 - 2024 |
| Forecast Period | 2026 - 2036 |
| Quantitative Units | Revenue in USD million/billion & CAGR from 2026 to 2036 |
| Country Scope | North America (U.S., Canada), Europe (UK, Germany, France, Italy, Spain, Russia, Sweden, Denmark, Norway, Rest of Europe), Asia Pacific (Japan, China, India, Australia, South Korea, Thailand, Rest of Asia Pacific), Latin America (Brazil, Mexico, Argentina, Colombia, Rest of Latin America), Middle East & Africa (South Africa, Saudi Arabia, UAE, Kuwait, Rest of Middle East & Africa). |
| The Segment Covered by Type |
|
| The Segment Covered by Route of Administration |
|
| Companies Covered |
|
| Report Coverage | Revenue forecast, company share, competitive landscape, growth factors, technology trends, and regional analysis |
| Free Customization Scope (Equivalent to 5 Analyst Working Days) | If you require additional insights beyond the current scope, our analysts can customize the report to meet your specific business needs. |
This report is developed using a rigorous research framework that combines extensive primary interviews, validated secondary sources, and detailed market modeling techniques. Every market estimate and forecast is subjected to multiple layers of verification to ensure consistency, reliability, and analytical accuracy.
Our research methodology prioritizes transparency, data integrity, and industry relevance. Information is gathered from credible healthcare databases, regulatory authorities, scientific publications, corporate disclosures, and expert consultations. This comprehensive approach enables stakeholders to gain a holistic understanding of market trends, competitive developments, technological advancements, and growth opportunities.
The report is designed to support strategic decision-making by delivering unbiased insights, evidence-based conclusions, and actionable intelligence tailored to the needs of investors, manufacturers, healthcare providers, distributors, and policymakers. By adhering to stringent research standards and industry best practices, the study provides a dependable foundation for evaluating current market conditions and future business prospects.
The research methodology employed for this study integrates qualitative and quantitative analytical techniques to provide a comprehensive evaluation of the Local Anesthesia Drugs Market. The process begins with extensive secondary research to collect historical market data, industry trends, regulatory information, clinical developments, and competitive intelligence from publicly available and proprietary sources.
This is complemented by primary research involving structured interviews and consultations with key industry stakeholders, including anesthesiologists, pain management specialists, hospital procurement managers, pharmaceutical manufacturers, distributors, industry practitioners, healthcare professionals, and key opinion leaders. Insights were validated through interviews with practicing anesthesiologists, surgical center administrators, and pharmaceutical procurement professionals, providing firsthand perspectives on prescribing patterns, product adoption trends, purchasing behavior, supply chain dynamics, pricing strategies, and emerging market opportunities.
Data triangulation techniques are utilized to validate findings and minimize discrepancies across multiple information sources. Information gathered through primary interviews is cross-verified with secondary research findings, company reports, regulatory databases, and industry publications to enhance accuracy and consistency.
Market forecasts are generated using advanced statistical models, trend analysis, demand-supply assessments, epidemiological trends, healthcare expenditure patterns, and macroeconomic evaluations. The methodology also incorporates regional and country-level analyses to ensure accurate representation of healthcare infrastructure, regulatory environments, reimbursement frameworks, and market-specific factors influencing growth.
This structured and multi-source approach enhances forecast reliability, reduces research bias, and supports informed strategic business decision-making.

Reviewed by healthcare market analyst with 10+ years of pharmaceutical industry research experience. Prepared by a team of experienced market researchers, healthcare analysts, and industry specialists, this report delivers a comprehensive examination of the global Local Anesthesia Drugs Market. Our analysts combine deep sector expertise with robust research methodologies to provide accurate, objective, and forward-looking market intelligence.
The study is designed to help business leaders, investors, healthcare organizations, and strategic decision-makers navigate an evolving healthcare landscape with confidence. Through a combination of data-driven analysis, expert validation, and industry-focused insights, the report provides a clear understanding of market dynamics, competitive developments, technological advancements, and future growth opportunities.
Our commitment to research excellence, analytical rigor, and factual accuracy ensures that stakeholders receive valuable intelligence capable of supporting both immediate business objectives and long-term strategic planning.
List of Tables
Table 1 List of Abbreviation and acronyms
Table 2 List of Sources
Table 3 North America Global Local Anesthesia Drugs Market, by Segment Analysis, (USD Million) 2017-2036
Table 4 North America Global Local Anesthesia Drugs Market, by Region, (USD Million) 2017-2036
Table 5 U.S. Global Local Anesthesia Drugs Market, by Segment Analysis, (USD Million) 2017-2036
Table 6 Canada Global Local Anesthesia Drugs Market, by Segment Analysis, (USD Million) 2017-2036
Table 7 Europe Global Local Anesthesia Drugs Market, by Segment Analysis, (USD Million) 2017-2036
Table 8 Europe Global Local Anesthesia Drugs Market, by Region, (USD Million) 2017-2036
Table 9 Germany Global Local Anesthesia Drugs Market, by Segment Analysis, (USD Million) 2017-2036
Table 10 U.K. Global Local Anesthesia Drugs Market, by Segment Analysis, (USD Million) 2017-2036
Table 11 France Global Local Anesthesia Drugs Market, by Segment Analysis, (USD Million) 2017-2036
Table 12 Italy Global Local Anesthesia Drugs Market, by Segment Analysis, (USD Million) 2017-2036
Table 13 Spain Global Local Anesthesia Drugs Market, by Segment Analysis, (USD Million) 2017-2036
Table 14 Sweden Global Local Anesthesia Drugs Market, by Segment Analysis, (USD Million) 2017-2036
Table 15 Denmark Global Local Anesthesia Drugs Market, by Segment Analysis, (USD Million) 2017-2036
Table 16 Norway Global Local Anesthesia Drugs Market, by Segment Analysis, (USD Million) 2017-2036
Table 17 The Netherlands Global Local Anesthesia Drugs Market, by Segment Analysis, (USD Million) 2017-2036
Table 18 Russia Global Local Anesthesia Drugs Market, by Segment Analysis, (USD Million) 2017-2036
Table 19 Asia Pacific Global Local Anesthesia Drugs Market, by Segment Analysis, (USD Million) 2017-2036
Table 20 Asia Pacific Global Local Anesthesia Drugs Market, by Region, (USD Million) 2017-2036
Table 21 China Global Local Anesthesia Drugs Market, by Segment Analysis, (USD Million) 2017-2036
Table 22 Japan Global Local Anesthesia Drugs Market, by Segment Analysis, (USD Million) 2017-2036
Table 23 India Global Local Anesthesia Drugs Market, by Segment Analysis, (USD Million) 2017-2036
Table 24 Australia Global Local Anesthesia Drugs Market, by Segment Analysis, (USD Million) 2017-2036
Table 25 South Korea Global Local Anesthesia Drugs Market, by Segment Analysis, (USD Million) 2017-2036
Table 26 Thailand Global Local Anesthesia Drugs Market, by Segment Analysis, (USD Million) 2017-2036
Table 27 Latin America Global Local Anesthesia Drugs Market, by Segment Analysis, (USD Million) 2017-2036
Table 28 Latin America Global Local Anesthesia Drugs Market, by Region, (USD Million) 2017-2036
Table 29 Brazil Global Local Anesthesia Drugs Market, by Segment Analysis, (USD Million) 2017-2036
Table 30 Mexico Global Local Anesthesia Drugs Market, by Segment Analysis, (USD Million) 2017-2036
Table 31 Argentina Global Local Anesthesia Drugs Market, by Segment Analysis, (USD Million) 2017-2036
Table 32 Middle East and Africa Global Local Anesthesia Drugs Market, by Segment Analysis, (USD Million) 2017-2036
Table 33 Middle East and Africa Global Local Anesthesia Drugs Market, by Region, (USD Million) 2017-2036
Table 34 South Africa Global Local Anesthesia Drugs Market, by Segment Analysis, (USD Million) 2017-2036
Table 35 Saudi Arabia Global Local Anesthesia Drugs Market, by Segment Analysis, (USD Million) 2017-2036
Table 36 UAE Global Local Anesthesia Drugs Market, by Segment Analysis, (USD Million) 2017-2036
Table 37 Kuwait Global Local Anesthesia Drugs Market, by Segment Analysis, (USD Million) 2017-2036
Table 38 Turkey Global Local Anesthesia Drugs Market, by Segment Analysis, (USD Million) 2017-2036
Fig.1 Market research process
Fig.2 Market research approaches
Fig.3 Global Local Anesthesia Drugs Market: market scenario
Fig.4 Global Local Anesthesia Drugs Market competitive outlook
Fig.5 Global Local Anesthesia Drugs Market driver analysis
Fig.6 Global Local Anesthesia Drugs Market restraint analysis
Fig.7 Global Local Anesthesia Drugs Market opportunity analysis
Fig.8 Global Local Anesthesia Drugs Market trends analysis
Fig.9 Global Local Anesthesia Drugs Market: Segment Analysis (Based on the scope)
Fig.10 Global Local Anesthesia Drugs Market: regional analysis
Fig.11 Global market shares and leading market players
Fig.12 North America market share and leading players
Fig.13 Europe market share and leading players
Fig.14 Asia Pacific market share and leading players
Fig.15 Latin America market share and leading players
Fig.16 Middle East & Africa market share and leading players
Fig.17 North America, by country
Fig.18 North America
Fig.19 North America market estimates and forecast, 2017-2036
Fig.20 U.S.
Fig.21 Canada
Fig.22 Europe
Fig.23 Europe market estimates and forecast, 2017-2036
Fig.24 U.K.
Fig.25 Germany
Fig.26 France
Fig.27 Italy
Fig.28 Spain
Fig.29 Sweden
Fig.30 Denmark
Fig.31 Norway
Fig.32 The Netherlands
Fig.33 Russia
Fig.34 Asia Pacific
Fig.35 Asia Pacific market estimates and forecast, 2017-2036
Fig.36 China
Fig.37 Japan
Fig.38 India
Fig.39 Australia
Fig.40 South Korea
Fig.41 Thailand
Fig.42 Latin America
Fig.43 Latin America market estimates and forecast, 2017-2036
Fig.44 Brazil
Fig.45 Mexico
Fig.46 Argentina
Fig.47 Colombia
Fig.48 Middle East and Africa
Fig.49 Middle East and Africa market estimates and forecast, 2017-2036
Fig.50 Saudi Arabia
Fig.51 South Africa
Fig.52 UAE
Fig.53 Kuwait
Fig.54 Turkey
The global Local Anesthesia Drugs Market is projected to grow from USD 4.28 billion in 2026 to USD 6.36 billion by 2036, expanding at a CAGR of 4.05% during the forecast period.
The Local Anesthesia Drugs Market is expected to register a compound annual growth rate (CAGR) of 4.05% between 2026 and 2036, driven by increasing surgical procedures and growing demand for effective pain management solutions.
Major growth drivers include rising surgical volumes, increasing adoption of minimally invasive procedures, growing outpatient treatment settings, advancements in anesthetic formulations, and expanding healthcare infrastructure in emerging economies.
Amide-based anesthetics, particularly lidocaine, bupivacaine, and ropivacaine, are expected to maintain significant market share due to their effectiveness, safety profile, and widespread use in surgical and dental procedures.
Injectable local anesthetics are anticipated to account for the largest market share owing to their extensive use across hospitals, ambulatory surgical centers, and specialty clinics.
North America is expected to maintain a leading position due to advanced healthcare infrastructure, high surgical procedure volumes, strong pharmaceutical presence, and increasing adoption of innovative anesthetic solutions.
The Asia-Pacific region is expected to witness significant growth due to increasing healthcare expenditure, expanding access to surgical care, growing patient populations, and ongoing healthcare modernization initiatives.
Key market participants include Pfizer Inc., Baxter International Inc., AbbVie Inc., Teva Pharmaceutical Industries Ltd., Hikma Pharmaceuticals PLC, and other global pharmaceutical manufacturers.
The global Local Anesthesia Drugs Market is poised for steady expansion over the next decade, driven by the growing volume of surgical procedures, increasing adoption of minimally invasive treatments, and rising demand for effective pain management solutions across healthcare settings. Local anesthetic drugs play a critical role in modern medicine by temporarily blocking nerve signals in a targeted area, enabling pain-free diagnostic, therapeutic, and surgical interventions while reducing the risks associated with general anesthesia.
The market is projected to grow from USD 4.28 billion in 2026 to USD 6.36 billion by 2036, registering a compound annual growth rate (CAGR) of 4.05% during the forecast period. The expansion is supported by advancements in anesthetic formulations, increasing outpatient surgical procedures, and the growing prevalence of chronic conditions requiring repeated medical interventions.
Healthcare providers worldwide are increasingly prioritizing patient-centric care models that emphasize faster recovery times, reduced hospital stays, and improved procedural efficiency. Local anesthesia drugs align closely with these objectives by offering targeted pain control, lower systemic complications, and enhanced patient safety profiles. Furthermore, rising healthcare investments across emerging economies and expanding access to surgical services are creating new opportunities for market participants.
Innovation remains a key market driver, with pharmaceutical companies focusing on longer-acting formulations, improved delivery systems, and combination therapies designed to optimize pain management outcomes. As healthcare systems continue to evolve toward cost-effective treatment approaches, local anesthesia drugs are expected to remain an essential component of clinical practice across hospitals, ambulatory surgical centers, dental clinics, and specialty healthcare facilities.
The Local Anesthesia Drugs Market continues to demonstrate resilient growth due to increasing surgical volumes, advancements in pain management technologies, and the rising preference for outpatient procedures. Local anesthetics have become indispensable across a broad range of medical disciplines, including dentistry, orthopedics, dermatology, ophthalmology, and general surgery. Their ability to provide targeted pain relief while minimizing recovery time has strengthened their adoption among healthcare professionals globally.
Market growth is being further supported by aging populations, increasing incidences of chronic diseases, and the growing demand for minimally invasive treatments. Healthcare providers are increasingly leveraging local anesthesia solutions to enhance patient comfort, improve procedural outcomes, and reduce healthcare costs associated with prolonged hospitalization.
Developed regions continue to benefit from advanced healthcare infrastructure and robust surgical volumes, while emerging economies are witnessing accelerated adoption due to healthcare modernization initiatives and expanding access to medical care. Continuous product development, regulatory approvals, and strategic collaborations among pharmaceutical manufacturers are expected to shape the competitive landscape and foster long-term market expansion through 2036.
" The regional assessment of the Local Anesthesia Drugs Market incorporates a comprehensive evaluation framework designed to capture market dynamics across major geographical regions, including North America, Europe, Asia-Pacific, Latin America, and the Middle East & Africa. The research methodology combines primary and secondary data collection techniques to ensure reliable market intelligence and actionable insights.
Primary research involves interviews with healthcare professionals, anesthesiologists, pharmaceutical executives, procurement specialists, and industry experts to understand current adoption trends, purchasing behaviors, and future growth opportunities. Secondary research includes the analysis of regulatory publications, healthcare databases, company reports, scientific journals, clinical studies, and industry associations.
Regional market estimations are developed by examining factors such as healthcare expenditure, surgical procedure volumes, reimbursement policies, demographic trends, healthcare infrastructure development, and the availability of anesthetic products. Country-level analyses further strengthen the accuracy of market projections by accounting for local regulatory environments, economic conditions, and healthcare accessibility. This multi-layered approach enables a comprehensive understanding of regional growth patterns and emerging opportunities across the global market landscape.
The competitive landscape of the Local Anesthesia Drugs Market is characterized by the presence of established pharmaceutical manufacturers, specialty drug developers, and emerging healthcare innovators. Market participants compete through product innovation, strategic partnerships, geographical expansion, regulatory approvals, and investments in research and development.
Leading companies are increasingly focusing on developing advanced anesthetic formulations with extended duration of action, improved safety profiles, and enhanced patient outcomes. Competitive differentiation is also being achieved through novel drug delivery technologies that improve precision, efficacy, and convenience during medical procedures.
In addition to product development, strategic mergers, acquisitions, licensing agreements, and collaborations with healthcare institutions have become important growth strategies. Companies are actively strengthening their global distribution networks to expand market penetration in both developed and emerging healthcare markets. As regulatory standards continue to evolve, organizations with strong clinical research capabilities and robust compliance frameworks are expected to maintain a competitive advantage.
The competitive environment remains dynamic, with innovation, regulatory expertise, and commercial scalability serving as key determinants of long-term success within the industry.
| Report Scope | Details |
| Report Version | 2026 |
| Growth Rate | CAGR of 4.05 % from 2026 to 2036 |
| Base Year | 2025 |
| Actual Estimates / Historical Data | 2017 - 2024 |
| Forecast Period | 2026 - 2036 |
| Quantitative Units | Revenue in USD million/billion & CAGR from 2026 to 2036 |
| Country Scope | North America (U.S., Canada), Europe (UK, Germany, France, Italy, Spain, Russia, Sweden, Denmark, Norway, Rest of Europe), Asia Pacific (Japan, China, India, Australia, South Korea, Thailand, Rest of Asia Pacific), Latin America (Brazil, Mexico, Argentina, Colombia, Rest of Latin America), Middle East & Africa (South Africa, Saudi Arabia, UAE, Kuwait, Rest of Middle East & Africa). |
| The Segment Covered by Type |
|
| The Segment Covered by Route of Administration |
|
| Companies Covered |
|
| Report Coverage | Revenue forecast, company share, competitive landscape, growth factors, technology trends, and regional analysis |
| Free Customization Scope (Equivalent to 5 Analyst Working Days) | If you require additional insights beyond the current scope, our analysts can customize the report to meet your specific business needs. |
This report is developed using a rigorous research framework that combines extensive primary interviews, validated secondary sources, and detailed market modeling techniques. Every market estimate and forecast is subjected to multiple layers of verification to ensure consistency, reliability, and analytical accuracy.
Our research methodology prioritizes transparency, data integrity, and industry relevance. Information is gathered from credible healthcare databases, regulatory authorities, scientific publications, corporate disclosures, and expert consultations. This comprehensive approach enables stakeholders to gain a holistic understanding of market trends, competitive developments, technological advancements, and growth opportunities.
The report is designed to support strategic decision-making by delivering unbiased insights, evidence-based conclusions, and actionable intelligence tailored to the needs of investors, manufacturers, healthcare providers, distributors, and policymakers. By adhering to stringent research standards and industry best practices, the study provides a dependable foundation for evaluating current market conditions and future business prospects.
The research methodology employed for this study integrates qualitative and quantitative analytical techniques to provide a comprehensive evaluation of the Local Anesthesia Drugs Market. The process begins with extensive secondary research to collect historical market data, industry trends, regulatory information, clinical developments, and competitive intelligence from publicly available and proprietary sources.
This is complemented by primary research involving structured interviews and consultations with key industry stakeholders, including anesthesiologists, pain management specialists, hospital procurement managers, pharmaceutical manufacturers, distributors, industry practitioners, healthcare professionals, and key opinion leaders. Insights were validated through interviews with practicing anesthesiologists, surgical center administrators, and pharmaceutical procurement professionals, providing firsthand perspectives on prescribing patterns, product adoption trends, purchasing behavior, supply chain dynamics, pricing strategies, and emerging market opportunities.
Data triangulation techniques are utilized to validate findings and minimize discrepancies across multiple information sources. Information gathered through primary interviews is cross-verified with secondary research findings, company reports, regulatory databases, and industry publications to enhance accuracy and consistency.
Market forecasts are generated using advanced statistical models, trend analysis, demand-supply assessments, epidemiological trends, healthcare expenditure patterns, and macroeconomic evaluations. The methodology also incorporates regional and country-level analyses to ensure accurate representation of healthcare infrastructure, regulatory environments, reimbursement frameworks, and market-specific factors influencing growth.
This structured and multi-source approach enhances forecast reliability, reduces research bias, and supports informed strategic business decision-making.
Reviewed by healthcare market analyst with 10+ years of pharmaceutical industry research experience. Prepared by a team of experienced market researchers, healthcare analysts, and industry specialists, this report delivers a comprehensive examination of the global Local Anesthesia Drugs Market. Our analysts combine deep sector expertise with robust research methodologies to provide accurate, objective, and forward-looking market intelligence.
The study is designed to help business leaders, investors, healthcare organizations, and strategic decision-makers navigate an evolving healthcare landscape with confidence. Through a combination of data-driven analysis, expert validation, and industry-focused insights, the report provides a clear understanding of market dynamics, competitive developments, technological advancements, and future growth opportunities.
Our commitment to research excellence, analytical rigor, and factual accuracy ensures that stakeholders receive valuable intelligence capable of supporting both immediate business objectives and long-term strategic planning.
Table 1 List of Abbreviation and acronyms
Table 2 List of Sources
Table 3 North America Global Local Anesthesia Drugs Market, by Segment Analysis, (USD Million) 2017-2036
Table 4 North America Global Local Anesthesia Drugs Market, by Region, (USD Million) 2017-2036
Table 5 U.S. Global Local Anesthesia Drugs Market, by Segment Analysis, (USD Million) 2017-2036
Table 6 Canada Global Local Anesthesia Drugs Market, by Segment Analysis, (USD Million) 2017-2036
Table 7 Europe Global Local Anesthesia Drugs Market, by Segment Analysis, (USD Million) 2017-2036
Table 8 Europe Global Local Anesthesia Drugs Market, by Region, (USD Million) 2017-2036
Table 9 Germany Global Local Anesthesia Drugs Market, by Segment Analysis, (USD Million) 2017-2036
Table 10 U.K. Global Local Anesthesia Drugs Market, by Segment Analysis, (USD Million) 2017-2036
Table 11 France Global Local Anesthesia Drugs Market, by Segment Analysis, (USD Million) 2017-2036
Table 12 Italy Global Local Anesthesia Drugs Market, by Segment Analysis, (USD Million) 2017-2036
Table 13 Spain Global Local Anesthesia Drugs Market, by Segment Analysis, (USD Million) 2017-2036
Table 14 Sweden Global Local Anesthesia Drugs Market, by Segment Analysis, (USD Million) 2017-2036
Table 15 Denmark Global Local Anesthesia Drugs Market, by Segment Analysis, (USD Million) 2017-2036
Table 16 Norway Global Local Anesthesia Drugs Market, by Segment Analysis, (USD Million) 2017-2036
Table 17 The Netherlands Global Local Anesthesia Drugs Market, by Segment Analysis, (USD Million) 2017-2036
Table 18 Russia Global Local Anesthesia Drugs Market, by Segment Analysis, (USD Million) 2017-2036
Table 19 Asia Pacific Global Local Anesthesia Drugs Market, by Segment Analysis, (USD Million) 2017-2036
Table 20 Asia Pacific Global Local Anesthesia Drugs Market, by Region, (USD Million) 2017-2036
Table 21 China Global Local Anesthesia Drugs Market, by Segment Analysis, (USD Million) 2017-2036
Table 22 Japan Global Local Anesthesia Drugs Market, by Segment Analysis, (USD Million) 2017-2036
Table 23 India Global Local Anesthesia Drugs Market, by Segment Analysis, (USD Million) 2017-2036
Table 24 Australia Global Local Anesthesia Drugs Market, by Segment Analysis, (USD Million) 2017-2036
Table 25 South Korea Global Local Anesthesia Drugs Market, by Segment Analysis, (USD Million) 2017-2036
Table 26 Thailand Global Local Anesthesia Drugs Market, by Segment Analysis, (USD Million) 2017-2036
Table 27 Latin America Global Local Anesthesia Drugs Market, by Segment Analysis, (USD Million) 2017-2036
Table 28 Latin America Global Local Anesthesia Drugs Market, by Region, (USD Million) 2017-2036
Table 29 Brazil Global Local Anesthesia Drugs Market, by Segment Analysis, (USD Million) 2017-2036
Table 30 Mexico Global Local Anesthesia Drugs Market, by Segment Analysis, (USD Million) 2017-2036
Table 31 Argentina Global Local Anesthesia Drugs Market, by Segment Analysis, (USD Million) 2017-2036
Table 32 Middle East and Africa Global Local Anesthesia Drugs Market, by Segment Analysis, (USD Million) 2017-2036
Table 33 Middle East and Africa Global Local Anesthesia Drugs Market, by Region, (USD Million) 2017-2036
Table 34 South Africa Global Local Anesthesia Drugs Market, by Segment Analysis, (USD Million) 2017-2036
Table 35 Saudi Arabia Global Local Anesthesia Drugs Market, by Segment Analysis, (USD Million) 2017-2036
Table 36 UAE Global Local Anesthesia Drugs Market, by Segment Analysis, (USD Million) 2017-2036
Table 37 Kuwait Global Local Anesthesia Drugs Market, by Segment Analysis, (USD Million) 2017-2036
Table 38 Turkey Global Local Anesthesia Drugs Market, by Segment Analysis, (USD Million) 2017-2036
Fig.1 Market research process
Fig.2 Market research approaches
Fig.3 Global Local Anesthesia Drugs Market: market scenario
Fig.4 Global Local Anesthesia Drugs Market competitive outlook
Fig.5 Global Local Anesthesia Drugs Market driver analysis
Fig.6 Global Local Anesthesia Drugs Market restraint analysis
Fig.7 Global Local Anesthesia Drugs Market opportunity analysis
Fig.8 Global Local Anesthesia Drugs Market trends analysis
Fig.9 Global Local Anesthesia Drugs Market: Segment Analysis (Based on the scope)
Fig.10 Global Local Anesthesia Drugs Market: regional analysis
Fig.11 Global market shares and leading market players
Fig.12 North America market share and leading players
Fig.13 Europe market share and leading players
Fig.14 Asia Pacific market share and leading players
Fig.15 Latin America market share and leading players
Fig.16 Middle East & Africa market share and leading players
Fig.17 North America, by country
Fig.18 North America
Fig.19 North America market estimates and forecast, 2017-2036
Fig.20 U.S.
Fig.21 Canada
Fig.22 Europe
Fig.23 Europe market estimates and forecast, 2017-2036
Fig.24 U.K.
Fig.25 Germany
Fig.26 France
Fig.27 Italy
Fig.28 Spain
Fig.29 Sweden
Fig.30 Denmark
Fig.31 Norway
Fig.32 The Netherlands
Fig.33 Russia
Fig.34 Asia Pacific
Fig.35 Asia Pacific market estimates and forecast, 2017-2036
Fig.36 China
Fig.37 Japan
Fig.38 India
Fig.39 Australia
Fig.40 South Korea
Fig.41 Thailand
Fig.42 Latin America
Fig.43 Latin America market estimates and forecast, 2017-2036
Fig.44 Brazil
Fig.45 Mexico
Fig.46 Argentina
Fig.47 Colombia
Fig.48 Middle East and Africa
Fig.49 Middle East and Africa market estimates and forecast, 2017-2036
Fig.50 Saudi Arabia
Fig.51 South Africa
Fig.52 UAE
Fig.53 Kuwait
Fig.54 Turkey

A license granted to one user. Rules or conditions might be applied for e.g. the use of electric files (PDFs) or printings, depending on product.
A license granted to multiple users.
A license granted to a single business site/establishment.
A license granted to all employees within organisation access to the product.
Immediate / Within 24-48 hours - Working days
Online Payments with PayPal and CCavenue
You can order a report by picking any of the payment methods which is bank wire or online payment through any Debit/Credit card or PayPal.
Hard Copy