EUV pellicles are ultra-thin membranes used in EUV lithography to protect photomasks from contamination during semiconductor manufacturing.
The global euv pellicle market was valued at USD 648.60 million in 2026 and is projected to reach USD 4.11 billion by 2036, growing at a CAGR of 19.47% during the forecast period. The market is driven by increasing demand for advanced semiconductor manufacturing and the rapid adoption of EUV lithography technologies.
The increasing adoption of EUV lithography in advanced semiconductor nodes is a key factor accelerating the growth of the EUV pellicle market.
The growing use of advanced imaging and sensing technologies in related sectors, such as the surveillance drone market, is further contributing to the demand for high-performance semiconductor components.
The EUV pellicle market focuses on the development of ultra-thin protective membranes used in extreme ultraviolet (EUV) lithography systems. These pellicles act as transparent shields that protect photomasks from particle contamination during high-precision semiconductor manufacturing.
Due to the extremely short wavelength of EUV light (13.5 nm), even microscopic defects can significantly impact chip yield. As a result, pellicles play a critical role in ensuring production accuracy in advanced semiconductor nodes below 5nm.
Unlike conventional pellicles used in deep ultraviolet (DUV) lithography, EUV pellicles require advanced materials that offer high transmittance and thermal stability. Materials such as polysilicon, silicon nitride, and carbon nanotubes are commonly used in these ultra-thin membranes.
The growing complexity of logic and memory chip fabrication is driving the adoption of EUV pellicles among semiconductor foundries and integrated device manufacturers (IDMs).


North America experiences rising interest in domestic EUV component ecosystems due to CHIPS Act funding. In the U.S., pellicle testing is ramping up at fab expansions by Intel and collaborative partners of IMEC. Canada is promoting semiconductor R&D and advanced materials innovation through the NRC and public–private pilot initiatives.
Europe focuses on strategic autonomy and supply chain diversification for EUV tooling. Germany and the Netherlands support pellicle R&D to reduce reliance on imported microfabrication components and align with the EU Chips Act roadmap.
Asia Pacific dominates the market through advanced chip production hubs. Taiwan, South Korea, and Japan lead in pellicle consumption and in-house innovation. China’s efforts to develop domestic EUV capacity also create demand for locally sourced pellicles.
Latin America is still nascent in semiconductor manufacturing but is showing interest in cleanroom and contamination control technologies, especially for microelectronics assembly hubs in Brazil and Mexico.
Middle East and Africa have limited involvement in advanced lithography; however, UAE and Israel are investing in chip packaging and R&D centers that could influence pellicle market presence in the future.
United States drives pellicle demand through domestic chipmaking incentives and Intel-led EUV fabs:
Germany supports EUV pellicle innovation through materials science and industrial alliances:
Japan advances pellicle manufacturing through legacy materials expertise and niche dominance:
The EUV pellicle market is highly specialized and concentrated among a few firms with proprietary expertise in nano-scale materials. Mitsui Chemicals is currently a leading commercial supplier, with its pellicles used in volume manufacturing at major foundries. Shin-Etsu and Daikin are also developing EUV-compatible solutions, leveraging their deep chemical materials portfolios.
ASML plays a central role in validating and integrating pellicle technologies into its EUV scanners. Only a few pellicles have been certified for high-power EUV tools like the NXE:3600D, creating a high barrier to new entrants. Firms that align with ASML’s development roadmap gain early mover advantage.
Startups and research consortia are exploring carbon nanotube and graphene-based pellicles for higher durability and EUV throughput. However, scale-up and yield remain critical hurdles for commercialization. Institutions like IMEC are supporting pilot trials for experimental pellicle designs in joint ventures with semiconductor toolmakers.
The market remains relatively closed due to IP protections and strategic dependencies. Governments are increasingly viewing EUV pellicles as a chokepoint in chip production and are funding domestic programs to explore alternative suppliers or establish local capabilities.
Companies that can achieve ASML qualification and maintain high transmittance with thermal stability are expected to dominate the market as EUV moves into high-volume production at 3nm and below.
ASML Holding N.V., Mitsui Chemicals, Inc., Shin-Etsu Chemical Co., Ltd., FUJIFILM Holdings Corporation, Toppan Inc., SÜSS MicroTec SE, Entegris, Inc., AGC Inc., Sumitomo Chemical Co., Ltd., SKC Co., Ltd., Canon Inc., Nikon Corporation, Applied Materials, Inc., Daicel Corporation, Dupont de Nemours, Inc., HOYA Corporation, JSR Corporation, NTT Advanced Technology Corporation, Samsung Electronics Co., Ltd., TSMC, Asahi Kasei, Fine Semitech, NEPCO, Canatu, and other players.

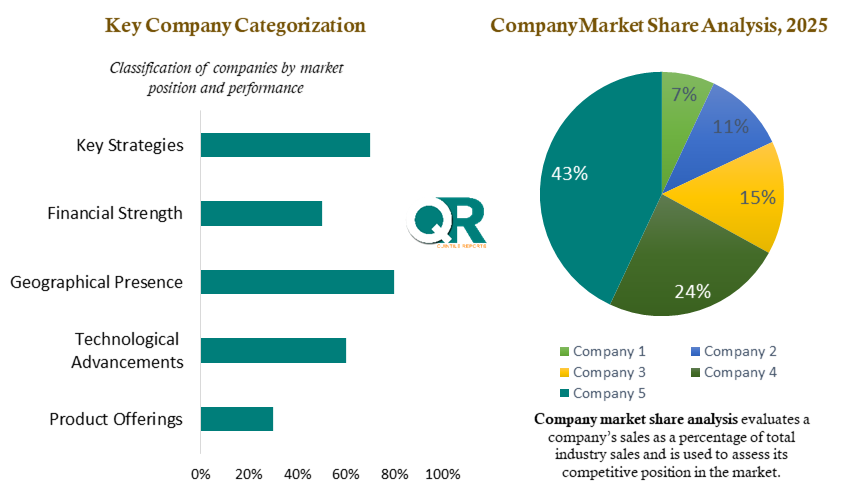
This section delivers an in-depth assessment of the competitive landscape within the EUV Pellicle market. It identifies key players and evaluates their market positioning, strategic initiatives, and core strengths. The company profiles include business overview, product and service portfolios, financial performance, and geographic presence. The analysis also highlights recent developments such as partnerships, mergers, product launches, and expansion strategies, helping stakeholders understand competitive intensity and benchmark industry leaders.
| Report Scope | Details |
| Report Version | 2026 |
| Growth Rate | CAGR of 19.47 from 2026 to 2035 |
| Base Year | 2025 |
| Actual Estimates / Historical Data | 2017 - 2024 |
| Forecast Period | 2026 - 2035 |
| Quantitative Units | Revenue in USD million/billion & CAGR from 2026 to 2035 |
| Country Scope | North America (U.S., Canada), Europe (UK, Germany, France, Italy, Spain, Russia, Sweden, Denmark, Norway, Rest of Europe), Asia Pacific (Japan, China, India, Australia, South Korea, Thailand, Rest of Asia Pacific), Latin America (Brazil, Mexico, Argentina, Colombia, Rest of Latin America), Middle East & Africa (South Africa, Saudi Arabia, UAE, Kuwait, Rest of Middle East & Africa). |
| The Segment Covered by Material |
|
| The Segment Covered by Application |
|
| Companies Covered |
|
| Report Coverage | Revenue forecast, company share, competitive landscape, growth factors, and trends |
| Free Customization Scope (Equivalent to 5 Analyst Working Days) | If you require additional insights beyond the current scope, our analysts can customize the report to meet your specific business needs. |

The EUV Pellicle market report provides detailed insights into market size, share, and growth trends for 2025, along with a comprehensive forecast outlook through 2035. The study combines historical analysis with future projections to deliver a complete market perspective. To request a sample PDF or obtain further information, contact our analyst team at sales@quintilereports.com.
List of Tables
Table 1 List of Abbreviation and acronyms
Table 2 List of Sources
Table 3 North America Global EUV Pellicle Market, by Segment Analysis, (USD Million) 2017-2035
Table 4 North America Global EUV Pellicle Market, by Region, (USD Million) 2017-2035
Table 5 U.S. Global EUV Pellicle Market, by Segment Analysis, (USD Million) 2017-2035
Table 6 Canada Global EUV Pellicle Market, by Segment Analysis, (USD Million) 2017-2035
Table 7 Europe Global EUV Pellicle Market, by Segment Analysis, (USD Million) 2017-2035
Table 8 Europe Global EUV Pellicle Market, by Region, (USD Million) 2017-2035
Table 9 Germany Global EUV Pellicle Market, by Segment Analysis, (USD Million) 2017-2035
Table 10 U.K. Global EUV Pellicle Market, by Segment Analysis, (USD Million) 2017-2035
Table 11 France Global EUV Pellicle Market, by Segment Analysis, (USD Million) 2017-2035
Table 12 Italy Global EUV Pellicle Market, by Segment Analysis, (USD Million) 2017-2035
Table 13 Spain Global EUV Pellicle Market, by Segment Analysis, (USD Million) 2017-2035
Table 14 Sweden Global EUV Pellicle Market, by Segment Analysis, (USD Million) 2017-2035
Table 15 Denmark Global EUV Pellicle Market, by Segment Analysis, (USD Million) 2017-2035
Table 16 Norway Global EUV Pellicle Market, by Segment Analysis, (USD Million) 2017-2035
Table 17 The Netherlands Global EUV Pellicle Market, by Segment Analysis, (USD Million) 2017-2035
Table 18 Russia Global EUV Pellicle Market, by Segment Analysis, (USD Million) 2017-2035
Table 19 Asia Pacific Global EUV Pellicle Market, by Segment Analysis, (USD Million) 2017-2035
Table 20 Asia Pacific Global EUV Pellicle Market, by Region, (USD Million) 2017-2035
Table 21 China Global EUV Pellicle Market, by Segment Analysis, (USD Million) 2017-2035
Table 22 Japan Global EUV Pellicle Market, by Segment Analysis, (USD Million) 2017-2035
Table 23 India Global EUV Pellicle Market, by Segment Analysis, (USD Million) 2017-2035
Table 24 Australia Global EUV Pellicle Market, by Segment Analysis, (USD Million) 2017-2035
Table 25 South Korea Global EUV Pellicle Market, by Segment Analysis, (USD Million) 2017-2035
Table 26 Thailand Global EUV Pellicle Market, by Segment Analysis, (USD Million) 2017-2035
Table 27 Latin America Global EUV Pellicle Market, by Segment Analysis, (USD Million) 2017-2035
Table 28 Latin America Global EUV Pellicle Market, by Region, (USD Million) 2017-2035
Table 29 Brazil Global EUV Pellicle Market, by Segment Analysis, (USD Million) 2017-2035
Table 30 Mexico Global EUV Pellicle Market, by Segment Analysis, (USD Million) 2017-2035
Table 31 Argentina Global EUV Pellicle Market, by Segment Analysis, (USD Million) 2017-2035
Table 32 Middle East and Africa Global EUV Pellicle Market, by Segment Analysis, (USD Million) 2017-2035
Table 33 Middle East and Africa Global EUV Pellicle Market, by Region, (USD Million) 2017-2035
Table 34 South Africa Global EUV Pellicle Market, by Segment Analysis, (USD Million) 2017-2035
Table 35 Saudi Arabia Global EUV Pellicle Market, by Segment Analysis, (USD Million) 2017-2035
Table 36 UAE Global EUV Pellicle Market, by Segment Analysis, (USD Million) 2017-2035
Table 37 Kuwait Global EUV Pellicle Market, by Segment Analysis, (USD Million) 2017-2035
Table 38 Turkey Global EUV Pellicle Market, by Segment Analysis, (USD Million) 2017-2035
Fig.1 Market research process
Fig.2 Market research approaches
Fig.3 Global EUV Pellicle Market: market scenario
Fig.4 Global EUV Pellicle Market competitive outlook
Fig.5 Global EUV Pellicle Market driver analysis
Fig.6 Global EUV Pellicle Market restraint analysis
Fig.7 Global EUV Pellicle Market opportunity analysis
Fig.8 Global EUV Pellicle Market trends analysis
Fig.9 Global EUV Pellicle Market: Segment Analysis (Based on the scope)
Fig.10 Global EUV Pellicle Market: regional analysis
Fig.11 Global market shares and leading market players
Fig.12 North America market share and leading players
Fig.13 Europe market share and leading players
Fig.14 Asia Pacific market share and leading players
Fig.15 Latin America market share and leading players
Fig.16 Middle East & Africa market share and leading players
Fig.17 North America, by country
Fig.18 North America
Fig.19 North America market estimates and forecast, 2017-2035
Fig.20 U.S.
Fig.21 Canada
Fig.22 Europe
Fig.23 Europe market estimates and forecast, 2017-2035
Fig.24 U.K.
Fig.25 Germany
Fig.26 France
Fig.27 Italy
Fig.28 Spain
Fig.29 Sweden
Fig.30 Denmark
Fig.31 Norway
Fig.32 The Netherlands
Fig.33 Russia
Fig.34 Asia Pacific
Fig.35 Asia Pacific market estimates and forecast, 2017-2035
Fig.36 China
Fig.37 Japan
Fig.38 India
Fig.39 Australia
Fig.40 South Korea
Fig.41 Thailand
Fig.42 Latin America
Fig.43 Latin America market estimates and forecast, 2017-2035
Fig.44 Brazil
Fig.45 Mexico
Fig.46 Argentina
Fig.47 Colombia
Fig.48 Middle East and Africa
Fig.49 Middle East and Africa market estimates and forecast, 2017-2035
Fig.50 Saudi Arabia
Fig.51 South Africa
Fig.52 UAE
Fig.53 Kuwait
Fig.54 Turkey
An EUV pellicle is an ultra-thin protective membrane used in extreme ultraviolet lithography to shield photomasks from contamination during semiconductor manufacturing. It is essential because even microscopic particles can damage chip patterns at advanced nodes below 5nm, making pellicles critical for ensuring production accuracy and yield.
The EUV pellicle market was valued at USD 648.60 million in 2026 and is projected to reach USD 4.11 billion by 2036, growing at a strong CAGR of 19.47% due to increasing demand for advanced semiconductor manufacturing technologies.
The growth of the EUV pellicle market is primarily driven by the rising adoption of EUV lithography in advanced semiconductor nodes, increasing demand for AI, 5G, and high-performance computing chips, and government initiatives supporting domestic semiconductor manufacturing. Additionally, collaborations between material science companies and semiconductor equipment manufacturers are accelerating innovation in pellicle technology.
EUV pellicles are manufactured using advanced materials such as polysilicon, silicon nitride, and carbon nanotubes, which provide high transparency to EUV light and strong thermal stability required for high-precision semiconductor fabrication processes.
Asia Pacific dominates the EUV pellicle market due to the presence of major semiconductor manufacturing hubs in countries like Taiwan, South Korea, and Japan, where demand for advanced chip production and EUV lithography technologies is significantly high.
The EUV pellicle market faces several challenges including high production costs, stringent material requirements, limited supplier availability, and durability concerns due to repeated exposure to EUV radiation, which can degrade pellicle performance over time.
Key players in the EUV pellicle market include ASML, Mitsui Chemicals, Shin-Etsu Chemical, Fujifilm, Toppan, Samsung Electronics, and other major semiconductor and materials companies that are actively involved in developing advanced pellicle solutions.
The future of the EUV pellicle market is highly promising with advancements in next-generation materials such as carbon nanotube pellicles, increasing EUV adoption in sub-3nm nodes, and continuous innovation aimed at improving durability, transmittance, and cost efficiency in semiconductor manufacturing.
EUV pellicles are ultra-thin membranes used in EUV lithography to protect photomasks from contamination during semiconductor manufacturing.
The global euv pellicle market was valued at USD 648.60 million in 2026 and is projected to reach USD 4.11 billion by 2036, growing at a CAGR of 19.47% during the forecast period. The market is driven by increasing demand for advanced semiconductor manufacturing and the rapid adoption of EUV lithography technologies.
The increasing adoption of EUV lithography in advanced semiconductor nodes is a key factor accelerating the growth of the EUV pellicle market.
The growing use of advanced imaging and sensing technologies in related sectors, such as the surveillance drone market, is further contributing to the demand for high-performance semiconductor components.
The EUV pellicle market focuses on the development of ultra-thin protective membranes used in extreme ultraviolet (EUV) lithography systems. These pellicles act as transparent shields that protect photomasks from particle contamination during high-precision semiconductor manufacturing.
Due to the extremely short wavelength of EUV light (13.5 nm), even microscopic defects can significantly impact chip yield. As a result, pellicles play a critical role in ensuring production accuracy in advanced semiconductor nodes below 5nm.
Unlike conventional pellicles used in deep ultraviolet (DUV) lithography, EUV pellicles require advanced materials that offer high transmittance and thermal stability. Materials such as polysilicon, silicon nitride, and carbon nanotubes are commonly used in these ultra-thin membranes.
The growing complexity of logic and memory chip fabrication is driving the adoption of EUV pellicles among semiconductor foundries and integrated device manufacturers (IDMs).
North America experiences rising interest in domestic EUV component ecosystems due to CHIPS Act funding. In the U.S., pellicle testing is ramping up at fab expansions by Intel and collaborative partners of IMEC. Canada is promoting semiconductor R&D and advanced materials innovation through the NRC and public–private pilot initiatives.
Europe focuses on strategic autonomy and supply chain diversification for EUV tooling. Germany and the Netherlands support pellicle R&D to reduce reliance on imported microfabrication components and align with the EU Chips Act roadmap.
Asia Pacific dominates the market through advanced chip production hubs. Taiwan, South Korea, and Japan lead in pellicle consumption and in-house innovation. China’s efforts to develop domestic EUV capacity also create demand for locally sourced pellicles.
Latin America is still nascent in semiconductor manufacturing but is showing interest in cleanroom and contamination control technologies, especially for microelectronics assembly hubs in Brazil and Mexico.
Middle East and Africa have limited involvement in advanced lithography; however, UAE and Israel are investing in chip packaging and R&D centers that could influence pellicle market presence in the future.
United States drives pellicle demand through domestic chipmaking incentives and Intel-led EUV fabs:
Germany supports EUV pellicle innovation through materials science and industrial alliances:
Japan advances pellicle manufacturing through legacy materials expertise and niche dominance:
The EUV pellicle market is highly specialized and concentrated among a few firms with proprietary expertise in nano-scale materials. Mitsui Chemicals is currently a leading commercial supplier, with its pellicles used in volume manufacturing at major foundries. Shin-Etsu and Daikin are also developing EUV-compatible solutions, leveraging their deep chemical materials portfolios.
ASML plays a central role in validating and integrating pellicle technologies into its EUV scanners. Only a few pellicles have been certified for high-power EUV tools like the NXE:3600D, creating a high barrier to new entrants. Firms that align with ASML’s development roadmap gain early mover advantage.
Startups and research consortia are exploring carbon nanotube and graphene-based pellicles for higher durability and EUV throughput. However, scale-up and yield remain critical hurdles for commercialization. Institutions like IMEC are supporting pilot trials for experimental pellicle designs in joint ventures with semiconductor toolmakers.
The market remains relatively closed due to IP protections and strategic dependencies. Governments are increasingly viewing EUV pellicles as a chokepoint in chip production and are funding domestic programs to explore alternative suppliers or establish local capabilities.
Companies that can achieve ASML qualification and maintain high transmittance with thermal stability are expected to dominate the market as EUV moves into high-volume production at 3nm and below.
ASML Holding N.V., Mitsui Chemicals, Inc., Shin-Etsu Chemical Co., Ltd., FUJIFILM Holdings Corporation, Toppan Inc., SÜSS MicroTec SE, Entegris, Inc., AGC Inc., Sumitomo Chemical Co., Ltd., SKC Co., Ltd., Canon Inc., Nikon Corporation, Applied Materials, Inc., Daicel Corporation, Dupont de Nemours, Inc., HOYA Corporation, JSR Corporation, NTT Advanced Technology Corporation, Samsung Electronics Co., Ltd., TSMC, Asahi Kasei, Fine Semitech, NEPCO, Canatu, and other players.
This section delivers an in-depth assessment of the competitive landscape within the EUV Pellicle market. It identifies key players and evaluates their market positioning, strategic initiatives, and core strengths. The company profiles include business overview, product and service portfolios, financial performance, and geographic presence. The analysis also highlights recent developments such as partnerships, mergers, product launches, and expansion strategies, helping stakeholders understand competitive intensity and benchmark industry leaders.
| Report Scope | Details |
| Report Version | 2026 |
| Growth Rate | CAGR of 19.47 from 2026 to 2035 |
| Base Year | 2025 |
| Actual Estimates / Historical Data | 2017 - 2024 |
| Forecast Period | 2026 - 2035 |
| Quantitative Units | Revenue in USD million/billion & CAGR from 2026 to 2035 |
| Country Scope | North America (U.S., Canada), Europe (UK, Germany, France, Italy, Spain, Russia, Sweden, Denmark, Norway, Rest of Europe), Asia Pacific (Japan, China, India, Australia, South Korea, Thailand, Rest of Asia Pacific), Latin America (Brazil, Mexico, Argentina, Colombia, Rest of Latin America), Middle East & Africa (South Africa, Saudi Arabia, UAE, Kuwait, Rest of Middle East & Africa). |
| The Segment Covered by Material |
|
| The Segment Covered by Application |
|
| Companies Covered |
|
| Report Coverage | Revenue forecast, company share, competitive landscape, growth factors, and trends |
| Free Customization Scope (Equivalent to 5 Analyst Working Days) | If you require additional insights beyond the current scope, our analysts can customize the report to meet your specific business needs. |
The EUV Pellicle market report provides detailed insights into market size, share, and growth trends for 2025, along with a comprehensive forecast outlook through 2035. The study combines historical analysis with future projections to deliver a complete market perspective. To request a sample PDF or obtain further information, contact our analyst team at sales@quintilereports.com.
Table 1 List of Abbreviation and acronyms
Table 2 List of Sources
Table 3 North America Global EUV Pellicle Market, by Segment Analysis, (USD Million) 2017-2035
Table 4 North America Global EUV Pellicle Market, by Region, (USD Million) 2017-2035
Table 5 U.S. Global EUV Pellicle Market, by Segment Analysis, (USD Million) 2017-2035
Table 6 Canada Global EUV Pellicle Market, by Segment Analysis, (USD Million) 2017-2035
Table 7 Europe Global EUV Pellicle Market, by Segment Analysis, (USD Million) 2017-2035
Table 8 Europe Global EUV Pellicle Market, by Region, (USD Million) 2017-2035
Table 9 Germany Global EUV Pellicle Market, by Segment Analysis, (USD Million) 2017-2035
Table 10 U.K. Global EUV Pellicle Market, by Segment Analysis, (USD Million) 2017-2035
Table 11 France Global EUV Pellicle Market, by Segment Analysis, (USD Million) 2017-2035
Table 12 Italy Global EUV Pellicle Market, by Segment Analysis, (USD Million) 2017-2035
Table 13 Spain Global EUV Pellicle Market, by Segment Analysis, (USD Million) 2017-2035
Table 14 Sweden Global EUV Pellicle Market, by Segment Analysis, (USD Million) 2017-2035
Table 15 Denmark Global EUV Pellicle Market, by Segment Analysis, (USD Million) 2017-2035
Table 16 Norway Global EUV Pellicle Market, by Segment Analysis, (USD Million) 2017-2035
Table 17 The Netherlands Global EUV Pellicle Market, by Segment Analysis, (USD Million) 2017-2035
Table 18 Russia Global EUV Pellicle Market, by Segment Analysis, (USD Million) 2017-2035
Table 19 Asia Pacific Global EUV Pellicle Market, by Segment Analysis, (USD Million) 2017-2035
Table 20 Asia Pacific Global EUV Pellicle Market, by Region, (USD Million) 2017-2035
Table 21 China Global EUV Pellicle Market, by Segment Analysis, (USD Million) 2017-2035
Table 22 Japan Global EUV Pellicle Market, by Segment Analysis, (USD Million) 2017-2035
Table 23 India Global EUV Pellicle Market, by Segment Analysis, (USD Million) 2017-2035
Table 24 Australia Global EUV Pellicle Market, by Segment Analysis, (USD Million) 2017-2035
Table 25 South Korea Global EUV Pellicle Market, by Segment Analysis, (USD Million) 2017-2035
Table 26 Thailand Global EUV Pellicle Market, by Segment Analysis, (USD Million) 2017-2035
Table 27 Latin America Global EUV Pellicle Market, by Segment Analysis, (USD Million) 2017-2035
Table 28 Latin America Global EUV Pellicle Market, by Region, (USD Million) 2017-2035
Table 29 Brazil Global EUV Pellicle Market, by Segment Analysis, (USD Million) 2017-2035
Table 30 Mexico Global EUV Pellicle Market, by Segment Analysis, (USD Million) 2017-2035
Table 31 Argentina Global EUV Pellicle Market, by Segment Analysis, (USD Million) 2017-2035
Table 32 Middle East and Africa Global EUV Pellicle Market, by Segment Analysis, (USD Million) 2017-2035
Table 33 Middle East and Africa Global EUV Pellicle Market, by Region, (USD Million) 2017-2035
Table 34 South Africa Global EUV Pellicle Market, by Segment Analysis, (USD Million) 2017-2035
Table 35 Saudi Arabia Global EUV Pellicle Market, by Segment Analysis, (USD Million) 2017-2035
Table 36 UAE Global EUV Pellicle Market, by Segment Analysis, (USD Million) 2017-2035
Table 37 Kuwait Global EUV Pellicle Market, by Segment Analysis, (USD Million) 2017-2035
Table 38 Turkey Global EUV Pellicle Market, by Segment Analysis, (USD Million) 2017-2035
Fig.1 Market research process
Fig.2 Market research approaches
Fig.3 Global EUV Pellicle Market: market scenario
Fig.4 Global EUV Pellicle Market competitive outlook
Fig.5 Global EUV Pellicle Market driver analysis
Fig.6 Global EUV Pellicle Market restraint analysis
Fig.7 Global EUV Pellicle Market opportunity analysis
Fig.8 Global EUV Pellicle Market trends analysis
Fig.9 Global EUV Pellicle Market: Segment Analysis (Based on the scope)
Fig.10 Global EUV Pellicle Market: regional analysis
Fig.11 Global market shares and leading market players
Fig.12 North America market share and leading players
Fig.13 Europe market share and leading players
Fig.14 Asia Pacific market share and leading players
Fig.15 Latin America market share and leading players
Fig.16 Middle East & Africa market share and leading players
Fig.17 North America, by country
Fig.18 North America
Fig.19 North America market estimates and forecast, 2017-2035
Fig.20 U.S.
Fig.21 Canada
Fig.22 Europe
Fig.23 Europe market estimates and forecast, 2017-2035
Fig.24 U.K.
Fig.25 Germany
Fig.26 France
Fig.27 Italy
Fig.28 Spain
Fig.29 Sweden
Fig.30 Denmark
Fig.31 Norway
Fig.32 The Netherlands
Fig.33 Russia
Fig.34 Asia Pacific
Fig.35 Asia Pacific market estimates and forecast, 2017-2035
Fig.36 China
Fig.37 Japan
Fig.38 India
Fig.39 Australia
Fig.40 South Korea
Fig.41 Thailand
Fig.42 Latin America
Fig.43 Latin America market estimates and forecast, 2017-2035
Fig.44 Brazil
Fig.45 Mexico
Fig.46 Argentina
Fig.47 Colombia
Fig.48 Middle East and Africa
Fig.49 Middle East and Africa market estimates and forecast, 2017-2035
Fig.50 Saudi Arabia
Fig.51 South Africa
Fig.52 UAE
Fig.53 Kuwait
Fig.54 Turkey

A license granted to one user. Rules or conditions might be applied for e.g. the use of electric files (PDFs) or printings, depending on product.
A license granted to multiple users.
A license granted to a single business site/establishment.
A license granted to all employees within organisation access to the product.
Immediate / Within 24-48 hours - Working days
Online Payments with PayPal and CCavenue
You can order a report by picking any of the payment methods which is bank wire or online payment through any Debit/Credit card or PayPal.
Hard Copy