The global Cosmetic Chemicals Market valued at USD 27.01 billion in 2025, is projected to reach USD 55.63 billion by 2035, with a CAGR of 7.72%. This robust growth highlights the increasing demand for advanced cosmetic ingredients across skincare, haircare, and personal care applications worldwide.
The cosmetic chemicals market size, trends, and forecast analysis indicate strong long-term growth driven by innovation, sustainability, and increasing demand for advanced personal care ingredients.
The cosmetic chemicals market is witnessing steady expansion as the demand for high-performance, multifunctional, and skin-compatible ingredients continues to rise. Growth is being driven by evolving consumer preferences for effective, safe, and sustainable beauty products, along with continuous innovation in formulation technologies. The increasing use of specialty chemicals such as surfactants, emollients, emulsifiers, and active agents is enabling brands to deliver enhanced product performance and improved sensory appeal across both mass-market and premium segments.
The cosmetic chemicals market, also referred to as the cosmetic ingredients market or personal care chemicals market, is evolving rapidly with advancements in formulation science and sustainability initiatives.
The growing consumer awareness regarding ingredient safety and product transparency is a major factor driving the cosmetic chemicals market. Manufacturers are increasingly focusing on developing high-purity, non-toxic, and environmentally friendly ingredients to meet evolving regulatory standards and consumer expectations. Additionally, the rapid growth of digital-first beauty brands and influencer-driven marketing is accelerating demand for innovative and fast-acting chemical formulations.
Another significant driver is the rising demand for multifunctional cosmetic ingredients that offer both aesthetic and therapeutic benefits. Ingredients such as peptides, ceramides, and plant-derived actives are gaining traction due to their ability to enhance product performance while supporting skin health. This trend is particularly strong in skincare, where consumers are seeking long-term benefits alongside immediate results.
The cosmetic industry is increasingly embracing sustainable practices, leading to a growing demand for biodegradable and ethically sourced chemical ingredients. Companies are investing in green chemistry and biotechnology to develop innovative solutions that reduce environmental impact while maintaining product effectiveness. This shift is reshaping ingredient sourcing, formulation strategies, and supply chain management across the industry.
At the same time, advancements in formulation technologies are enabling the development of lightweight, long-lasting, and high-performance cosmetic products. The integration of advanced emulsification systems and active delivery mechanisms is enhancing product stability and efficacy. As a result, cosmetic chemicals are becoming more sophisticated, supporting the next generation of beauty and personal care innovations.

The cosmetic chemicals market encompasses a wide array of ingredients used in the formulation of personal care and beauty products. These include surfactants, emollients, emulsifiers, preservatives, colorants, active agents, and UV filters. Each of these substances serves a distinct role in ensuring that cosmetic products perform effectively, remain shelf-stable, and provide the sensory appeal consumers expect from modern formulations. The market supplies raw chemical components to contract manufacturers, brand owners, and cosmetic OEMs across the globe.
In recent years, the focus of the industry has shifted toward high-purity, multi-functional, and skin-compatible compounds. Chemical suppliers are responding by introducing materials that not only meet aesthetic and functional expectations but also comply with increasingly strict global regulatory standards. Whether used in mass-market skincare or high-end dermo-cosmetic applications, cosmetic chemicals play a central role in shaping product innovation, brand differentiation, and consumer loyalty across beauty categories.
Growing demand for skincare products that offer both functional and sensory benefits is driving innovation in cosmetic ingredients. Consumers are now more aware of what goes into their creams, cleansers, and serums, prompting a shift toward ingredients that are not only effective but perceived as safe and ethical. This change in consumer awareness is pushing companies to adopt clean-label strategies and develop products with simpler, traceable chemical compositions.
The rise of digital-first beauty brands and influencer-driven marketing has accelerated product development cycles and increased the need for customizable, fast-acting ingredients. Chemical suppliers are responding with versatile emulsifiers, gentle surfactants, and natural-origin polymers that enhance product texture and efficacy. These ingredients are designed to deliver consistent performance across various skin types and climate conditions, helping brands expand their reach globally.
Innovation is also being fueled by the wellness crossover in cosmetics. Consumers expect products to offer not just external beauty benefits but also support holistic well-being. This has led to increased usage of cosmetic actives such as peptides, ceramides, and adaptogenschemical agents originally developed for pharmaceutical or nutraceutical applications. The result is a growing category of hybrid products where cosmetic and therapeutic functions converge.
Sustainability is a major influence on chemical selection and supply chain planning. Brands are increasingly asking for biodegradable, non-toxic, and ethically sourced ingredients that reduce environmental impact without compromising performance. In response, chemical companies are reformulating legacy products, investing in green chemistry, and creating ingredient platforms that align with circular economy principles and corporate sustainability targets.
Key challenge in the cosmetic chemicals market is managing compliance with a complex and evolving regulatory environment. Different regions have varying requirements regarding ingredient safety, allergen labeling, and environmental impact. Keeping pace with updates to frameworks with various regulation acts requires significant investment in testing, documentation, and reformulation.
Another constraint comes from the growing demand for natural and plant-derived ingredients. While these substances are perceived as safer and more eco-friendly, they often present issues related to stability, consistency, and scalability. For chemical suppliers, this means developing extraction and preservation techniques that protect the integrity of bioactive compounds while ensuring reproducible quality at industrial scale.
The volatility of raw material costs also impacts the industry. Many base chemicals used in cosmetic formulations are derived from petrochemical or agricultural sources, making them vulnerable to price fluctuations linked to global events, weather conditions, and geopolitical disruptions. These cost pressures can squeeze margins and force manufacturers to adjust product lines or reformulation priorities mid-cycle.
The technical demands of modern cosmetic formulations continue to rise. Consumers want products that feel lightweight, absorb quickly, last longer, and offer visible results. Meeting these expectations often requires sophisticated emulsification systems, controlled-release agents, and active carriers, which add complexity to formulation and manufacturing processes. These factors can slow product development and increase production costs, especially for smaller firms.

North America is a mature but rapidly evolving market, led by trends in clean beauty and biotech-based actives. The region supports growth in both high-end and mass-market segments. Regulatory updates and retail transparency initiatives are prompting reformulation across categories.
Europes cosmetic chemical market is shaped by sustainability mandates and ingredient disclosure laws. Countries such as Germany, France, and Italy continue to influence global ingredient safety and testing protocols. Demand remains strong for biodegradable, compliant materials in both skincare and fragrance.
Asia Pacific leads in innovation and consumption, with countries like Japan, South Korea, and China driving global ingredient development. Local brands seek high-performance actives for skin whitening, sun care, and hydration, while manufacturers prioritize low-irritation, multifunctional chemicals.
Latin America sees growing demand for natural and tropical plant-derived actives. Brazil and Mexico are expanding their cosmetic ingredient production capacity. Local trends favor hair care and body care ingredients that can be sourced and manufactured regionally.
This region is gradually expanding cosmetic ingredient use in high-end skincare and halal-certified formulations. The UAE, South Africa, and Saudi Arabia are emerging as distribution hubs for both international and regional cosmetic chemical producers.
In the United States, the cosmetic chemicals sector is seeing a shift toward ingredient transparency and cleaner formulation practices. The enactment of the Modernization of Cosmetics Regulation Act (MoCRA) marks a pivotal development in the regulatory landscape of the U.S. chemicals and cosmetics market. The chemical ingredients used in cosmetics such as preservatives, fragrances, emulsifiers, and colorants are now subject to closer scrutiny and quality control. These regulatory changes are not seen as barriers but as opportunities to invest in more efficient and skin-safe chemical innovation.
Simultaneously, partnerships between ingredient suppliers and cosmetic brands are enabling rapid development of functional materials that meet performance needs across makeup, skincare, and hair care segments. U.S.-based manufacturers are also investing in green chemistry and sustainable sourcing to better align with corporate ESG targets and the preferences of digitally active consumer groups who demand visible accountability from beauty brands.
Germanys cosmetic chemical industry is built on precision engineering, advanced formulation science, and regulatory alignment with European safety standards. The country serves as a center for specialty chemical innovation, offering highly refined emollients, surfactants, and encapsulation agents for both domestic and export markets. This ecosystem supports a broad range of personal care product types, from medical-grade skincare to decorative cosmetics.
German suppliers are also expanding their role in environmental stewardship by focusing on biodegradable polymers and naturally derived preservatives. Their production systems are tightly integrated with renewable energy use, closed-loop water management, and chemical recovery processes. As a result, German companies not only offer high-quality materials but also set industry benchmarks for environmental and operational sustainability.
Japans cosmetic chemical market is distinguished by a strong focus on multifunctional performance, formulation elegance, and long-term skin compatibility. Japanese manufacturers often favor ingredients that combine sensory enhancement with clinical efficacy, producing results that are subtle yet consistent over time. This reflects the country's broader philosophy of gentle, preventive care and layered routines.
Product developers in Japan work closely with domestic chemical producers to ensure ingredient profiles are optimized for packaging efficiency, product stability, and minimal irritation. Innovations frequently center around moisture retention, sebum control, and UV resistance, using chemistry that supports repeat use without overwhelming the skin. This precision-driven approach supports both luxury and everyday brands seeking to deliver long-term consumer trust.

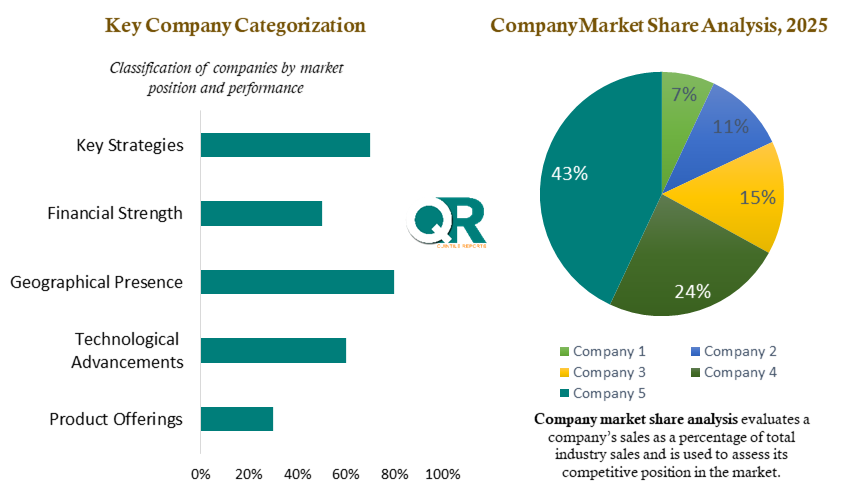
The cosmetic chemicals industry is populated by multinational corporations, regional formulators, and niche ingredient specialists. Global firms dominate supply in high-volume categories like emulsifiers, surfactants, and preservatives. These companies operate extensive research labs and manufacturing sites around the world, offering custom formulation support and regulatory assistance to brands in every major market.
One of the key competitive areas is sustainability, where top suppliers are investing in biotechnology, fermentation-based actives, and green solvents. These initiatives are not only addressing consumer concerns but also improving process efficiency and long-term cost control. Companies with the ability to deliver consistent quality while meeting clean-label and environmental certifications are gaining strategic advantage with large brands and private-label retailers.
Regional players in Asia, Latin America, and Europe are finding success by localizing supply chains and focusing on culturally relevant formulations. These firms often specialize in natural oils, botanical extracts, and regional fragrance blends. Their agility and lower-cost structures allow them to compete effectively in mid-tier and premium categories, especially in fast-growing regional markets.
Collaboration is another core strategy. Ingredient companies are increasingly forming joint ventures with academic institutions, biotech firms, and packaging specialists to create multi-functional chemical systems. These partnerships help develop materials that not only perform better but also improve product delivery, shelf life, and consumer safety.
Innovation pipelines are being enhanced by AI-assisted formulation platforms and data-driven ingredient mapping tools. Companies investing in digitalization and smart testing protocols are gaining speed in R&D cycles, reducing time-to-market and improving alignment with regulatory and consumer trends.
| Report Scope | Details |
| Report Version | 2026 |
| Growth Rate | CAGR of 7.72 from 2026 to 2035 |
| Base Year | 2025 |
| Actual Estimates / Historical Data | 2017 - 2024 |
| Forecast Period | 2026 - 2035 |
| Quantitative Units | Revenue in USD million/billion & CAGR from 2026 to 2035 |
| Country Scope | North America (U.S., Canada), Europe (UK, Germany, France, Italy, Spain, Russia, Sweden, Denmark, Norway, Rest of Europe), Asia Pacific (Japan, China, India, Australia, South Korea, Thailand, Rest of Asia Pacific), Latin America (Brazil, Mexico, Argentina, Colombia, Rest of Latin America), Middle East & Africa (South Africa, Saudi Arabia, UAE, Kuwait, Rest of Middle East & Africa). |
| The Segment Covered by Product Type |
|
| The Segment Covered by Active Ingredients |
|
| Companies Covered |
|
| Report Coverage | Revenue forecast, company share, competitive landscape, growth factors, and trends |
| Free Customization Scope (Equivalent to 5 Analyst Working Days) | If you require additional insights beyond the current scope, our analysts can customize the report to meet your specific business needs. |

The Cosmetic Chemicals market report provides detailed insights into market size, share, and growth trends for 2025, along with a comprehensive forecast outlook through 2035. The study combines historical analysis with future projections to deliver a complete market perspective. To request a sample PDF or obtain further information, contact our analyst team at sales@quintilereports.com.
List of Tables
Table 1 List of Abbreviation and acronyms
Table 2 List of Sources
Table 3 North America Global Cosmetic Chemicals Market, by Segment Analysis, (USD Million) 2017-2035
Table 4 North America Global Cosmetic Chemicals Market, by Region, (USD Million) 2017-2035
Table 5 U.S. Global Cosmetic Chemicals Market, by Segment Analysis, (USD Million) 2017-2035
Table 6 Canada Global Cosmetic Chemicals Market, by Segment Analysis, (USD Million) 2017-2035
Table 7 Europe Global Cosmetic Chemicals Market, by Segment Analysis, (USD Million) 2017-2035
Table 8 Europe Global Cosmetic Chemicals Market, by Region, (USD Million) 2017-2035
Table 9 Germany Global Cosmetic Chemicals Market, by Segment Analysis, (USD Million) 2017-2035
Table 10 U.K. Global Cosmetic Chemicals Market, by Segment Analysis, (USD Million) 2017-2035
Table 11 France Global Cosmetic Chemicals Market, by Segment Analysis, (USD Million) 2017-2035
Table 12 Italy Global Cosmetic Chemicals Market, by Segment Analysis, (USD Million) 2017-2035
Table 13 Spain Global Cosmetic Chemicals Market, by Segment Analysis, (USD Million) 2017-2035
Table 14 Sweden Global Cosmetic Chemicals Market, by Segment Analysis, (USD Million) 2017-2035
Table 15 Denmark Global Cosmetic Chemicals Market, by Segment Analysis, (USD Million) 2017-2035
Table 16 Norway Global Cosmetic Chemicals Market, by Segment Analysis, (USD Million) 2017-2035
Table 17 The Netherlands Global Cosmetic Chemicals Market, by Segment Analysis, (USD Million) 2017-2035
Table 18 Russia Global Cosmetic Chemicals Market, by Segment Analysis, (USD Million) 2017-2035
Table 19 Asia Pacific Global Cosmetic Chemicals Market, by Segment Analysis, (USD Million) 2017-2035
Table 20 Asia Pacific Global Cosmetic Chemicals Market, by Region, (USD Million) 2017-2035
Table 21 China Global Cosmetic Chemicals Market, by Segment Analysis, (USD Million) 2017-2035
Table 22 Japan Global Cosmetic Chemicals Market, by Segment Analysis, (USD Million) 2017-2035
Table 23 India Global Cosmetic Chemicals Market, by Segment Analysis, (USD Million) 2017-2035
Table 24 Australia Global Cosmetic Chemicals Market, by Segment Analysis, (USD Million) 2017-2035
Table 25 South Korea Global Cosmetic Chemicals Market, by Segment Analysis, (USD Million) 2017-2035
Table 26 Thailand Global Cosmetic Chemicals Market, by Segment Analysis, (USD Million) 2017-2035
Table 27 Latin America Global Cosmetic Chemicals Market, by Segment Analysis, (USD Million) 2017-2035
Table 28 Latin America Global Cosmetic Chemicals Market, by Region, (USD Million) 2017-2035
Table 29 Brazil Global Cosmetic Chemicals Market, by Segment Analysis, (USD Million) 2017-2035
Table 30 Mexico Global Cosmetic Chemicals Market, by Segment Analysis, (USD Million) 2017-2035
Table 31 Argentina Global Cosmetic Chemicals Market, by Segment Analysis, (USD Million) 2017-2035
Table 32 Middle East and Africa Global Cosmetic Chemicals Market, by Segment Analysis, (USD Million) 2017-2035
Table 33 Middle East and Africa Global Cosmetic Chemicals Market, by Region, (USD Million) 2017-2035
Table 34 South Africa Global Cosmetic Chemicals Market, by Segment Analysis, (USD Million) 2017-2035
Table 35 Saudi Arabia Global Cosmetic Chemicals Market, by Segment Analysis, (USD Million) 2017-2035
Table 36 UAE Global Cosmetic Chemicals Market, by Segment Analysis, (USD Million) 2017-2035
Table 37 Kuwait Global Cosmetic Chemicals Market, by Segment Analysis, (USD Million) 2017-2035
Table 38 Turkey Global Cosmetic Chemicals Market, by Segment Analysis, (USD Million) 2017-2035
Fig.1 Market research process
Fig.2 Market research approaches
Fig.3 Global Cosmetic Chemicals Market: market scenario
Fig.4 Global Cosmetic Chemicals Market competitive outlook
Fig.5 Global Cosmetic Chemicals Market driver analysis
Fig.6 Global Cosmetic Chemicals Market restraint analysis
Fig.7 Global Cosmetic Chemicals Market opportunity analysis
Fig.8 Global Cosmetic Chemicals Market trends analysis
Fig.9 Global Cosmetic Chemicals Market: Segment Analysis (Based on the scope)
Fig.10 Global Cosmetic Chemicals Market: regional analysis
Fig.11 Global market shares and leading market players
Fig.12 North America market share and leading players
Fig.13 Europe market share and leading players
Fig.14 Asia Pacific market share and leading players
Fig.15 Latin America market share and leading players
Fig.16 Middle East & Africa market share and leading players
Fig.17 North America, by country
Fig.18 North America
Fig.19 North America market estimates and forecast, 2017-2035
Fig.20 U.S.
Fig.21 Canada
Fig.22 Europe
Fig.23 Europe market estimates and forecast, 2017-2035
Fig.24 U.K.
Fig.25 Germany
Fig.26 France
Fig.27 Italy
Fig.28 Spain
Fig.29 Sweden
Fig.30 Denmark
Fig.31 Norway
Fig.32 The Netherlands
Fig.33 Russia
Fig.34 Asia Pacific
Fig.35 Asia Pacific market estimates and forecast, 2017-2035
Fig.36 China
Fig.37 Japan
Fig.38 India
Fig.39 Australia
Fig.40 South Korea
Fig.41 Thailand
Fig.42 Latin America
Fig.43 Latin America market estimates and forecast, 2017-2035
Fig.44 Brazil
Fig.45 Mexico
Fig.46 Argentina
Fig.47 Colombia
Fig.48 Middle East and Africa
Fig.49 Middle East and Africa market estimates and forecast, 2017-2035
Fig.50 Saudi Arabia
Fig.51 South Africa
Fig.52 UAE
Fig.53 Kuwait
Fig.54 Turkey
The global Cosmetic Chemicals Market valued at USD 27.01 billion in 2025, is projected to reach USD 55.63 billion by 2035, with a CAGR of 7.72%. This robust growth highlights the increasing demand for advanced cosmetic ingredients across skincare, haircare, and personal care applications worldwide.
The cosmetic chemicals market size, trends, and forecast analysis indicate strong long-term growth driven by innovation, sustainability, and increasing demand for advanced personal care ingredients.
The cosmetic chemicals market is witnessing steady expansion as the demand for high-performance, multifunctional, and skin-compatible ingredients continues to rise. Growth is being driven by evolving consumer preferences for effective, safe, and sustainable beauty products, along with continuous innovation in formulation technologies. The increasing use of specialty chemicals such as surfactants, emollients, emulsifiers, and active agents is enabling brands to deliver enhanced product performance and improved sensory appeal across both mass-market and premium segments.
The cosmetic chemicals market, also referred to as the cosmetic ingredients market or personal care chemicals market, is evolving rapidly with advancements in formulation science and sustainability initiatives.
The growing consumer awareness regarding ingredient safety and product transparency is a major factor driving the cosmetic chemicals market. Manufacturers are increasingly focusing on developing high-purity, non-toxic, and environmentally friendly ingredients to meet evolving regulatory standards and consumer expectations. Additionally, the rapid growth of digital-first beauty brands and influencer-driven marketing is accelerating demand for innovative and fast-acting chemical formulations.
Another significant driver is the rising demand for multifunctional cosmetic ingredients that offer both aesthetic and therapeutic benefits. Ingredients such as peptides, ceramides, and plant-derived actives are gaining traction due to their ability to enhance product performance while supporting skin health. This trend is particularly strong in skincare, where consumers are seeking long-term benefits alongside immediate results.
The cosmetic industry is increasingly embracing sustainable practices, leading to a growing demand for biodegradable and ethically sourced chemical ingredients. Companies are investing in green chemistry and biotechnology to develop innovative solutions that reduce environmental impact while maintaining product effectiveness. This shift is reshaping ingredient sourcing, formulation strategies, and supply chain management across the industry.
At the same time, advancements in formulation technologies are enabling the development of lightweight, long-lasting, and high-performance cosmetic products. The integration of advanced emulsification systems and active delivery mechanisms is enhancing product stability and efficacy. As a result, cosmetic chemicals are becoming more sophisticated, supporting the next generation of beauty and personal care innovations.
The cosmetic chemicals market encompasses a wide array of ingredients used in the formulation of personal care and beauty products. These include surfactants, emollients, emulsifiers, preservatives, colorants, active agents, and UV filters. Each of these substances serves a distinct role in ensuring that cosmetic products perform effectively, remain shelf-stable, and provide the sensory appeal consumers expect from modern formulations. The market supplies raw chemical components to contract manufacturers, brand owners, and cosmetic OEMs across the globe.
In recent years, the focus of the industry has shifted toward high-purity, multi-functional, and skin-compatible compounds. Chemical suppliers are responding by introducing materials that not only meet aesthetic and functional expectations but also comply with increasingly strict global regulatory standards. Whether used in mass-market skincare or high-end dermo-cosmetic applications, cosmetic chemicals play a central role in shaping product innovation, brand differentiation, and consumer loyalty across beauty categories.
Growing demand for skincare products that offer both functional and sensory benefits is driving innovation in cosmetic ingredients. Consumers are now more aware of what goes into their creams, cleansers, and serums, prompting a shift toward ingredients that are not only effective but perceived as safe and ethical. This change in consumer awareness is pushing companies to adopt clean-label strategies and develop products with simpler, traceable chemical compositions.
The rise of digital-first beauty brands and influencer-driven marketing has accelerated product development cycles and increased the need for customizable, fast-acting ingredients. Chemical suppliers are responding with versatile emulsifiers, gentle surfactants, and natural-origin polymers that enhance product texture and efficacy. These ingredients are designed to deliver consistent performance across various skin types and climate conditions, helping brands expand their reach globally.
Innovation is also being fueled by the wellness crossover in cosmetics. Consumers expect products to offer not just external beauty benefits but also support holistic well-being. This has led to increased usage of cosmetic actives such as peptides, ceramides, and adaptogenschemical agents originally developed for pharmaceutical or nutraceutical applications. The result is a growing category of hybrid products where cosmetic and therapeutic functions converge.
Sustainability is a major influence on chemical selection and supply chain planning. Brands are increasingly asking for biodegradable, non-toxic, and ethically sourced ingredients that reduce environmental impact without compromising performance. In response, chemical companies are reformulating legacy products, investing in green chemistry, and creating ingredient platforms that align with circular economy principles and corporate sustainability targets.
Key challenge in the cosmetic chemicals market is managing compliance with a complex and evolving regulatory environment. Different regions have varying requirements regarding ingredient safety, allergen labeling, and environmental impact. Keeping pace with updates to frameworks with various regulation acts requires significant investment in testing, documentation, and reformulation.
Another constraint comes from the growing demand for natural and plant-derived ingredients. While these substances are perceived as safer and more eco-friendly, they often present issues related to stability, consistency, and scalability. For chemical suppliers, this means developing extraction and preservation techniques that protect the integrity of bioactive compounds while ensuring reproducible quality at industrial scale.
The volatility of raw material costs also impacts the industry. Many base chemicals used in cosmetic formulations are derived from petrochemical or agricultural sources, making them vulnerable to price fluctuations linked to global events, weather conditions, and geopolitical disruptions. These cost pressures can squeeze margins and force manufacturers to adjust product lines or reformulation priorities mid-cycle.
The technical demands of modern cosmetic formulations continue to rise. Consumers want products that feel lightweight, absorb quickly, last longer, and offer visible results. Meeting these expectations often requires sophisticated emulsification systems, controlled-release agents, and active carriers, which add complexity to formulation and manufacturing processes. These factors can slow product development and increase production costs, especially for smaller firms.
North America is a mature but rapidly evolving market, led by trends in clean beauty and biotech-based actives. The region supports growth in both high-end and mass-market segments. Regulatory updates and retail transparency initiatives are prompting reformulation across categories.
Europes cosmetic chemical market is shaped by sustainability mandates and ingredient disclosure laws. Countries such as Germany, France, and Italy continue to influence global ingredient safety and testing protocols. Demand remains strong for biodegradable, compliant materials in both skincare and fragrance.
Asia Pacific leads in innovation and consumption, with countries like Japan, South Korea, and China driving global ingredient development. Local brands seek high-performance actives for skin whitening, sun care, and hydration, while manufacturers prioritize low-irritation, multifunctional chemicals.
Latin America sees growing demand for natural and tropical plant-derived actives. Brazil and Mexico are expanding their cosmetic ingredient production capacity. Local trends favor hair care and body care ingredients that can be sourced and manufactured regionally.
This region is gradually expanding cosmetic ingredient use in high-end skincare and halal-certified formulations. The UAE, South Africa, and Saudi Arabia are emerging as distribution hubs for both international and regional cosmetic chemical producers.
In the United States, the cosmetic chemicals sector is seeing a shift toward ingredient transparency and cleaner formulation practices. The enactment of the Modernization of Cosmetics Regulation Act (MoCRA) marks a pivotal development in the regulatory landscape of the U.S. chemicals and cosmetics market. The chemical ingredients used in cosmetics such as preservatives, fragrances, emulsifiers, and colorants are now subject to closer scrutiny and quality control. These regulatory changes are not seen as barriers but as opportunities to invest in more efficient and skin-safe chemical innovation.
Simultaneously, partnerships between ingredient suppliers and cosmetic brands are enabling rapid development of functional materials that meet performance needs across makeup, skincare, and hair care segments. U.S.-based manufacturers are also investing in green chemistry and sustainable sourcing to better align with corporate ESG targets and the preferences of digitally active consumer groups who demand visible accountability from beauty brands.
Germanys cosmetic chemical industry is built on precision engineering, advanced formulation science, and regulatory alignment with European safety standards. The country serves as a center for specialty chemical innovation, offering highly refined emollients, surfactants, and encapsulation agents for both domestic and export markets. This ecosystem supports a broad range of personal care product types, from medical-grade skincare to decorative cosmetics.
German suppliers are also expanding their role in environmental stewardship by focusing on biodegradable polymers and naturally derived preservatives. Their production systems are tightly integrated with renewable energy use, closed-loop water management, and chemical recovery processes. As a result, German companies not only offer high-quality materials but also set industry benchmarks for environmental and operational sustainability.
Japans cosmetic chemical market is distinguished by a strong focus on multifunctional performance, formulation elegance, and long-term skin compatibility. Japanese manufacturers often favor ingredients that combine sensory enhancement with clinical efficacy, producing results that are subtle yet consistent over time. This reflects the country's broader philosophy of gentle, preventive care and layered routines.
Product developers in Japan work closely with domestic chemical producers to ensure ingredient profiles are optimized for packaging efficiency, product stability, and minimal irritation. Innovations frequently center around moisture retention, sebum control, and UV resistance, using chemistry that supports repeat use without overwhelming the skin. This precision-driven approach supports both luxury and everyday brands seeking to deliver long-term consumer trust.
The cosmetic chemicals industry is populated by multinational corporations, regional formulators, and niche ingredient specialists. Global firms dominate supply in high-volume categories like emulsifiers, surfactants, and preservatives. These companies operate extensive research labs and manufacturing sites around the world, offering custom formulation support and regulatory assistance to brands in every major market.
One of the key competitive areas is sustainability, where top suppliers are investing in biotechnology, fermentation-based actives, and green solvents. These initiatives are not only addressing consumer concerns but also improving process efficiency and long-term cost control. Companies with the ability to deliver consistent quality while meeting clean-label and environmental certifications are gaining strategic advantage with large brands and private-label retailers.
Regional players in Asia, Latin America, and Europe are finding success by localizing supply chains and focusing on culturally relevant formulations. These firms often specialize in natural oils, botanical extracts, and regional fragrance blends. Their agility and lower-cost structures allow them to compete effectively in mid-tier and premium categories, especially in fast-growing regional markets.
Collaboration is another core strategy. Ingredient companies are increasingly forming joint ventures with academic institutions, biotech firms, and packaging specialists to create multi-functional chemical systems. These partnerships help develop materials that not only perform better but also improve product delivery, shelf life, and consumer safety.
Innovation pipelines are being enhanced by AI-assisted formulation platforms and data-driven ingredient mapping tools. Companies investing in digitalization and smart testing protocols are gaining speed in R&D cycles, reducing time-to-market and improving alignment with regulatory and consumer trends.
| Report Scope | Details |
| Report Version | 2026 |
| Growth Rate | CAGR of 7.72 from 2026 to 2035 |
| Base Year | 2025 |
| Actual Estimates / Historical Data | 2017 - 2024 |
| Forecast Period | 2026 - 2035 |
| Quantitative Units | Revenue in USD million/billion & CAGR from 2026 to 2035 |
| Country Scope | North America (U.S., Canada), Europe (UK, Germany, France, Italy, Spain, Russia, Sweden, Denmark, Norway, Rest of Europe), Asia Pacific (Japan, China, India, Australia, South Korea, Thailand, Rest of Asia Pacific), Latin America (Brazil, Mexico, Argentina, Colombia, Rest of Latin America), Middle East & Africa (South Africa, Saudi Arabia, UAE, Kuwait, Rest of Middle East & Africa). |
| The Segment Covered by Product Type |
|
| The Segment Covered by Active Ingredients |
|
| Companies Covered |
|
| Report Coverage | Revenue forecast, company share, competitive landscape, growth factors, and trends |
| Free Customization Scope (Equivalent to 5 Analyst Working Days) | If you require additional insights beyond the current scope, our analysts can customize the report to meet your specific business needs. |
The Cosmetic Chemicals market report provides detailed insights into market size, share, and growth trends for 2025, along with a comprehensive forecast outlook through 2035. The study combines historical analysis with future projections to deliver a complete market perspective. To request a sample PDF or obtain further information, contact our analyst team at sales@quintilereports.com.
Table 1 List of Abbreviation and acronyms
Table 2 List of Sources
Table 3 North America Global Cosmetic Chemicals Market, by Segment Analysis, (USD Million) 2017-2035
Table 4 North America Global Cosmetic Chemicals Market, by Region, (USD Million) 2017-2035
Table 5 U.S. Global Cosmetic Chemicals Market, by Segment Analysis, (USD Million) 2017-2035
Table 6 Canada Global Cosmetic Chemicals Market, by Segment Analysis, (USD Million) 2017-2035
Table 7 Europe Global Cosmetic Chemicals Market, by Segment Analysis, (USD Million) 2017-2035
Table 8 Europe Global Cosmetic Chemicals Market, by Region, (USD Million) 2017-2035
Table 9 Germany Global Cosmetic Chemicals Market, by Segment Analysis, (USD Million) 2017-2035
Table 10 U.K. Global Cosmetic Chemicals Market, by Segment Analysis, (USD Million) 2017-2035
Table 11 France Global Cosmetic Chemicals Market, by Segment Analysis, (USD Million) 2017-2035
Table 12 Italy Global Cosmetic Chemicals Market, by Segment Analysis, (USD Million) 2017-2035
Table 13 Spain Global Cosmetic Chemicals Market, by Segment Analysis, (USD Million) 2017-2035
Table 14 Sweden Global Cosmetic Chemicals Market, by Segment Analysis, (USD Million) 2017-2035
Table 15 Denmark Global Cosmetic Chemicals Market, by Segment Analysis, (USD Million) 2017-2035
Table 16 Norway Global Cosmetic Chemicals Market, by Segment Analysis, (USD Million) 2017-2035
Table 17 The Netherlands Global Cosmetic Chemicals Market, by Segment Analysis, (USD Million) 2017-2035
Table 18 Russia Global Cosmetic Chemicals Market, by Segment Analysis, (USD Million) 2017-2035
Table 19 Asia Pacific Global Cosmetic Chemicals Market, by Segment Analysis, (USD Million) 2017-2035
Table 20 Asia Pacific Global Cosmetic Chemicals Market, by Region, (USD Million) 2017-2035
Table 21 China Global Cosmetic Chemicals Market, by Segment Analysis, (USD Million) 2017-2035
Table 22 Japan Global Cosmetic Chemicals Market, by Segment Analysis, (USD Million) 2017-2035
Table 23 India Global Cosmetic Chemicals Market, by Segment Analysis, (USD Million) 2017-2035
Table 24 Australia Global Cosmetic Chemicals Market, by Segment Analysis, (USD Million) 2017-2035
Table 25 South Korea Global Cosmetic Chemicals Market, by Segment Analysis, (USD Million) 2017-2035
Table 26 Thailand Global Cosmetic Chemicals Market, by Segment Analysis, (USD Million) 2017-2035
Table 27 Latin America Global Cosmetic Chemicals Market, by Segment Analysis, (USD Million) 2017-2035
Table 28 Latin America Global Cosmetic Chemicals Market, by Region, (USD Million) 2017-2035
Table 29 Brazil Global Cosmetic Chemicals Market, by Segment Analysis, (USD Million) 2017-2035
Table 30 Mexico Global Cosmetic Chemicals Market, by Segment Analysis, (USD Million) 2017-2035
Table 31 Argentina Global Cosmetic Chemicals Market, by Segment Analysis, (USD Million) 2017-2035
Table 32 Middle East and Africa Global Cosmetic Chemicals Market, by Segment Analysis, (USD Million) 2017-2035
Table 33 Middle East and Africa Global Cosmetic Chemicals Market, by Region, (USD Million) 2017-2035
Table 34 South Africa Global Cosmetic Chemicals Market, by Segment Analysis, (USD Million) 2017-2035
Table 35 Saudi Arabia Global Cosmetic Chemicals Market, by Segment Analysis, (USD Million) 2017-2035
Table 36 UAE Global Cosmetic Chemicals Market, by Segment Analysis, (USD Million) 2017-2035
Table 37 Kuwait Global Cosmetic Chemicals Market, by Segment Analysis, (USD Million) 2017-2035
Table 38 Turkey Global Cosmetic Chemicals Market, by Segment Analysis, (USD Million) 2017-2035
Fig.1 Market research process
Fig.2 Market research approaches
Fig.3 Global Cosmetic Chemicals Market: market scenario
Fig.4 Global Cosmetic Chemicals Market competitive outlook
Fig.5 Global Cosmetic Chemicals Market driver analysis
Fig.6 Global Cosmetic Chemicals Market restraint analysis
Fig.7 Global Cosmetic Chemicals Market opportunity analysis
Fig.8 Global Cosmetic Chemicals Market trends analysis
Fig.9 Global Cosmetic Chemicals Market: Segment Analysis (Based on the scope)
Fig.10 Global Cosmetic Chemicals Market: regional analysis
Fig.11 Global market shares and leading market players
Fig.12 North America market share and leading players
Fig.13 Europe market share and leading players
Fig.14 Asia Pacific market share and leading players
Fig.15 Latin America market share and leading players
Fig.16 Middle East & Africa market share and leading players
Fig.17 North America, by country
Fig.18 North America
Fig.19 North America market estimates and forecast, 2017-2035
Fig.20 U.S.
Fig.21 Canada
Fig.22 Europe
Fig.23 Europe market estimates and forecast, 2017-2035
Fig.24 U.K.
Fig.25 Germany
Fig.26 France
Fig.27 Italy
Fig.28 Spain
Fig.29 Sweden
Fig.30 Denmark
Fig.31 Norway
Fig.32 The Netherlands
Fig.33 Russia
Fig.34 Asia Pacific
Fig.35 Asia Pacific market estimates and forecast, 2017-2035
Fig.36 China
Fig.37 Japan
Fig.38 India
Fig.39 Australia
Fig.40 South Korea
Fig.41 Thailand
Fig.42 Latin America
Fig.43 Latin America market estimates and forecast, 2017-2035
Fig.44 Brazil
Fig.45 Mexico
Fig.46 Argentina
Fig.47 Colombia
Fig.48 Middle East and Africa
Fig.49 Middle East and Africa market estimates and forecast, 2017-2035
Fig.50 Saudi Arabia
Fig.51 South Africa
Fig.52 UAE
Fig.53 Kuwait
Fig.54 Turkey

A license granted to one user. Rules or conditions might be applied for e.g. the use of electric files (PDFs) or printings, depending on product.
A license granted to multiple users.
A license granted to a single business site/establishment.
A license granted to all employees within organisation access to the product.
Immediate / Within 24-48 hours - Working days
Online Payments with PayPal and CCavenue
You can order a report by picking any of the payment methods which is bank wire or online payment through any Debit/Credit card or PayPal.
Hard Copy
 U.S. : +91-626-560-6898